

Principles of QTL mapping, contd.
To calculate the strength of the association between genotype and phenotype, the mapping population is split into two groups, according to the allele they carry for that trait at each marker in turn. Then the mean trait value of these two classes is compared. If the difference is significant, then this provides initial evidence for the location of a QTL in the neighbourhood of the marker (Young 1996).
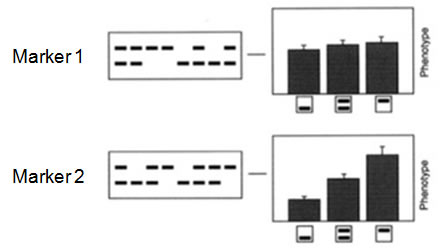
In this example from Young (1996), there is no significant difference in the mean trait value whether the progeny are homozygous for either of the Marker 1 parental alleles or are heterozygous. But at Marker 2, it is clear that the mean trait value of the three allelic groups is marker allele-dependent, indicating a probable QTL for this trait near Marker 2.