

Methods of QTL detection: interval mapping
Interval mapping (IM) (Lander and Botstein 1989) analyses pairs of linked markers rather than one marker at a time. It is statistically more powerful. The output is more typically in a graphical form, as in the figure below.
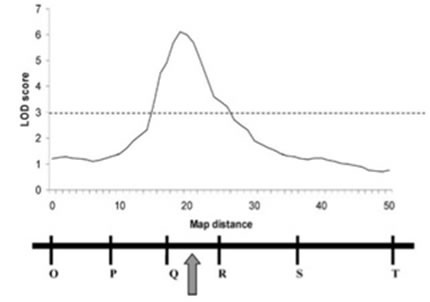
A hypothetical example of interval mapping output from Collard et al. (2005). IM gives a slightly more specific location of the QTL.