

Output from a single point regression
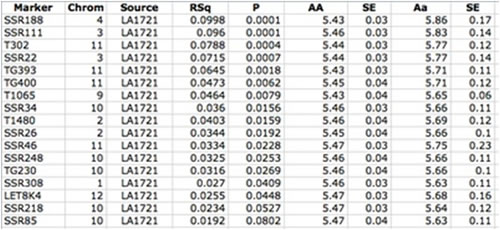
This is an example of partial data output from a single point regression (using the software QGene). Each marker is shown with the statistical results for this trait (sugar content, measured as brix units). The population was a BC, so there are only 2 genotypic classes, AA or Aa. AA shows the mean amount of sugars for plants homozygous for the A allele; Aa shows the mean amount of sugars for heterozygous plants (this was a backcross, so the “aa” homozygous wild allele class does not exist). “Source” signifies the allele (from which parent) giving the increased effect. In this example LA1721 was the wild parent. P is the probability score (smaller is more significant).
(continued next page)