

Output from a single point regression, contd
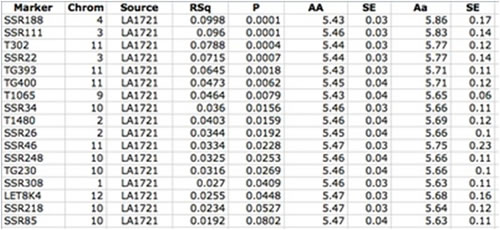
The table is given in the order of significance (P value), so the most significant QTL is linked to SSR188 on chromosome 4. This QTL explains almost 10% (9.98) of the variation in sugars in this population. Plants in the population which are AA at SSR188 have a mean sugar level of 5.43, while Aa plants have a mean level of 5.86 (SE = standard error).