

Image Modified From: http://phymap.ucdavis.educowpea/
Contributors
Shawn Yarnes a, Bao-Lam Huynhb, Timothy J. Closeb, Philip A. Robertsb, Darren Murrayc, Roger Paynec, Zhengzheng Zhangc
?a The Integrated Breeding Platform, b University of California, Riverside, c VSN International Ltd
Summary
Use the standalone Breeding View application to correlate population genotypic variance and population phenotypic variance to identify quantitative trait loci (QTL). Visualize QTL, map, and genotypes using Flapjack.
- Introduction
- QTL demonstration Data
- Start New QTL Project
- Import Data Files
- Run Analysis
- Analysis Options
- Results
- Visualize QTL in Flapjack
- References
Introduction
Breeding View uses a combination of simple interval mapping (SIM) and composite interval mapping (CIM) to identify statistically significant associations between markers and traits as well as to identify the peak positions of the linkage map associated with the traits evaluated. This is done by testing for significant correlations at each of the marker positions as well as between markers. The SIM method is followed by CIM to increase the power of the genome-wide QTL search. CIM uses candidate QTLs identified by SIM as cofactors in the QTL scan model to control for variation caused by QTL outside the test region.
QTL Demonstration Data
This QTL mapping case study is based on the published work of Huynh et al. 2015. The purpose of this study is to identify genetic loci associated with aphid resistance for eventual introgression into the susceptible cowpea (Vigna unguiculata)? line, CB27. See associated tutorial, Marker-Assisted Backcross Breeding for Aphid Resistance. A mapping population of recombinant inbreed line (RILs) was developed by crossing the aphid susceptible line, CB27, with an aphid resistant line, IT97K-556-6, and selfing the progeny by single seed decent for 8 generations. The genotypic and phenotypic data used in this study represent a population (N=94) of 92 RILs and the 2 parental lines, CB27 and IT97K-556-6. The population has been genotyped with 438 markers mapped to 11 linkage groups.
Three data files are needed to perform a QTL analysis:
The map file specifies the marker locations by linkage group and position (cM) within the 11 linkage groups. The genotype file contains the marker scores for each of the 92 individuals in the population. The map and genotype files are plain text files in Flapjack format. The phenotype data file contains the observations of one or more traits of each individual in the population.
Start New QTL Project
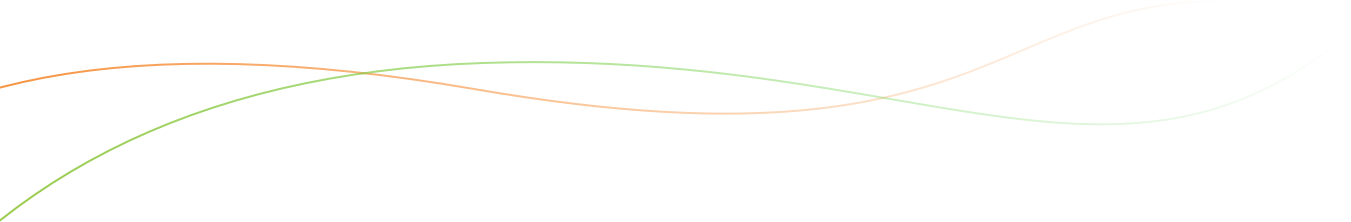
- Launch the standalone Breeding View application from the left hand Workbench menu.
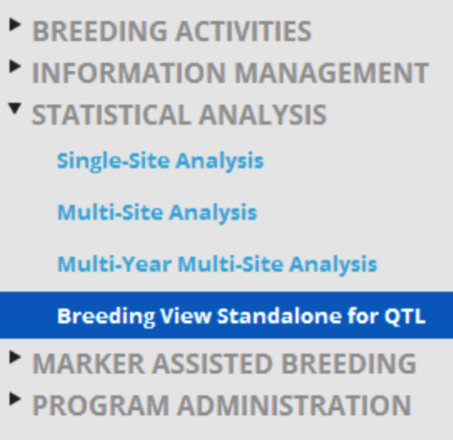
When Breeding View is launched, the Project window and Analysis Pipeline will not contain any information.
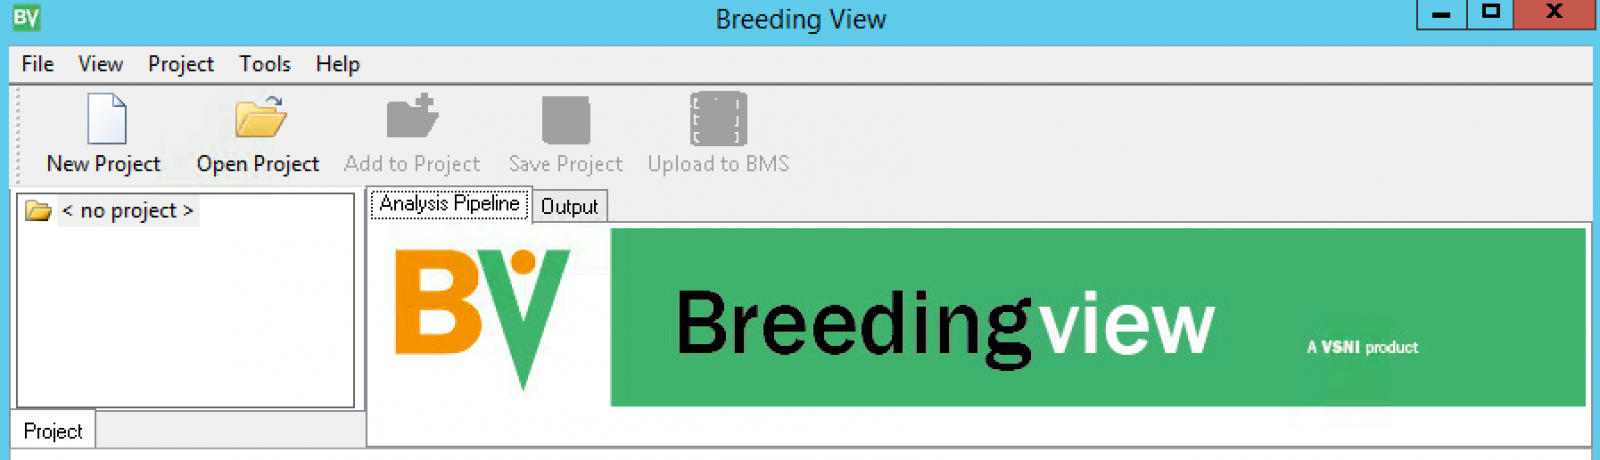
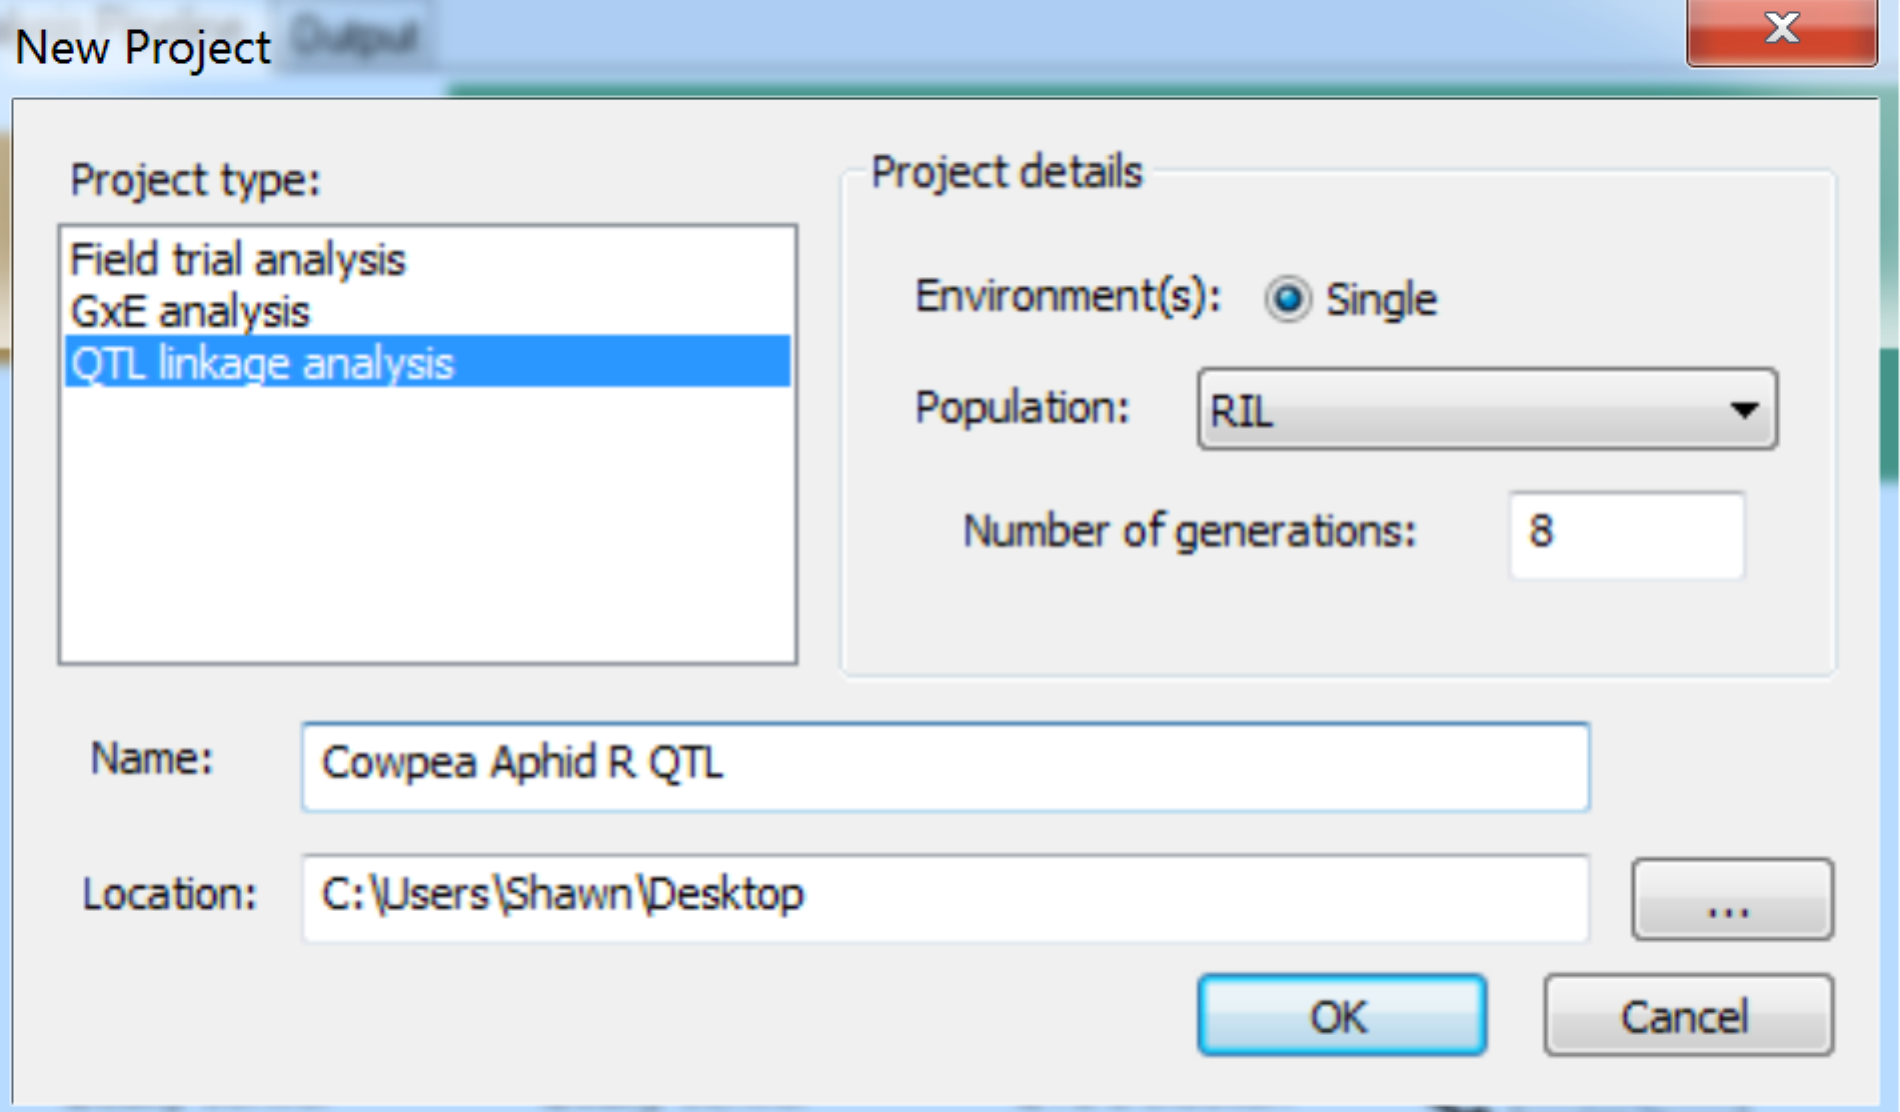
- Create a new project, by selecting File > New Project from the menu bar, or click on the New Project tool button. In the New Project dialog, select the QTL linkage analysis item within the Project type list. Enter project details. The current version only supports single site analysis, so select Single for the Environment and choose the appropriate Population description from list. Select RIL population and 8 generations. Name the project and select the location of the working directory. Click OK to create the project.
When a project has been created, the Analysis Pipeline is displayed along with project details on the left. The Analysis Pipeline includes nodes, which are connected by arrows. Each node represents a different task that is performed within the QTL analysis pipeline.
.png)
Import Data Files
The genotypic and phenotypic data along with a map file need to be imported into the project before the analysis pipeline can be run.
Data Files?
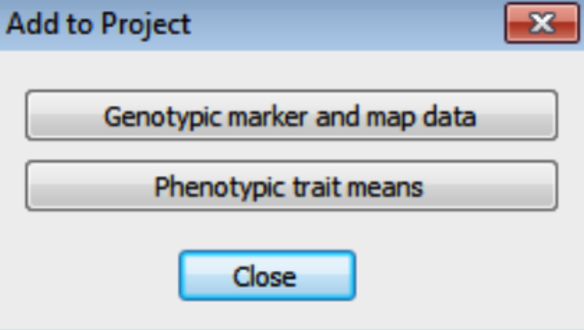
- Import the genotypic data by selecting Project > Add Data from the menu, or click on the Add to Project tool button. On the Add to Project dialog, click on the Genotypic marker and Map Data button.
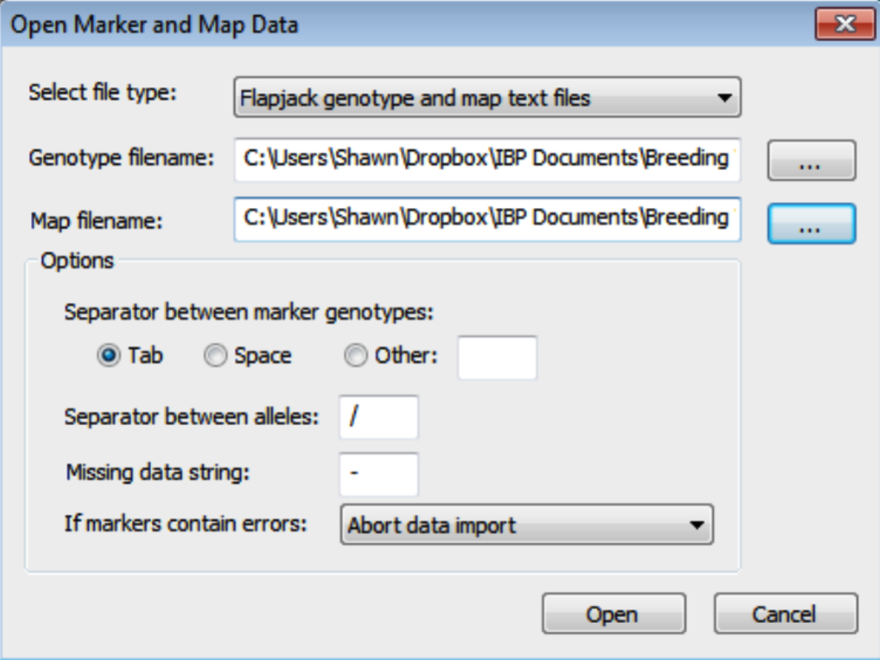
- In the Open Marker and Map Data dialog, select the Flapjack formatted genotype and map .txt files. Browse for files by clicking on the [...] button. Click Open to import the data. Breeding View will only import information on markers common to genotype and map files.
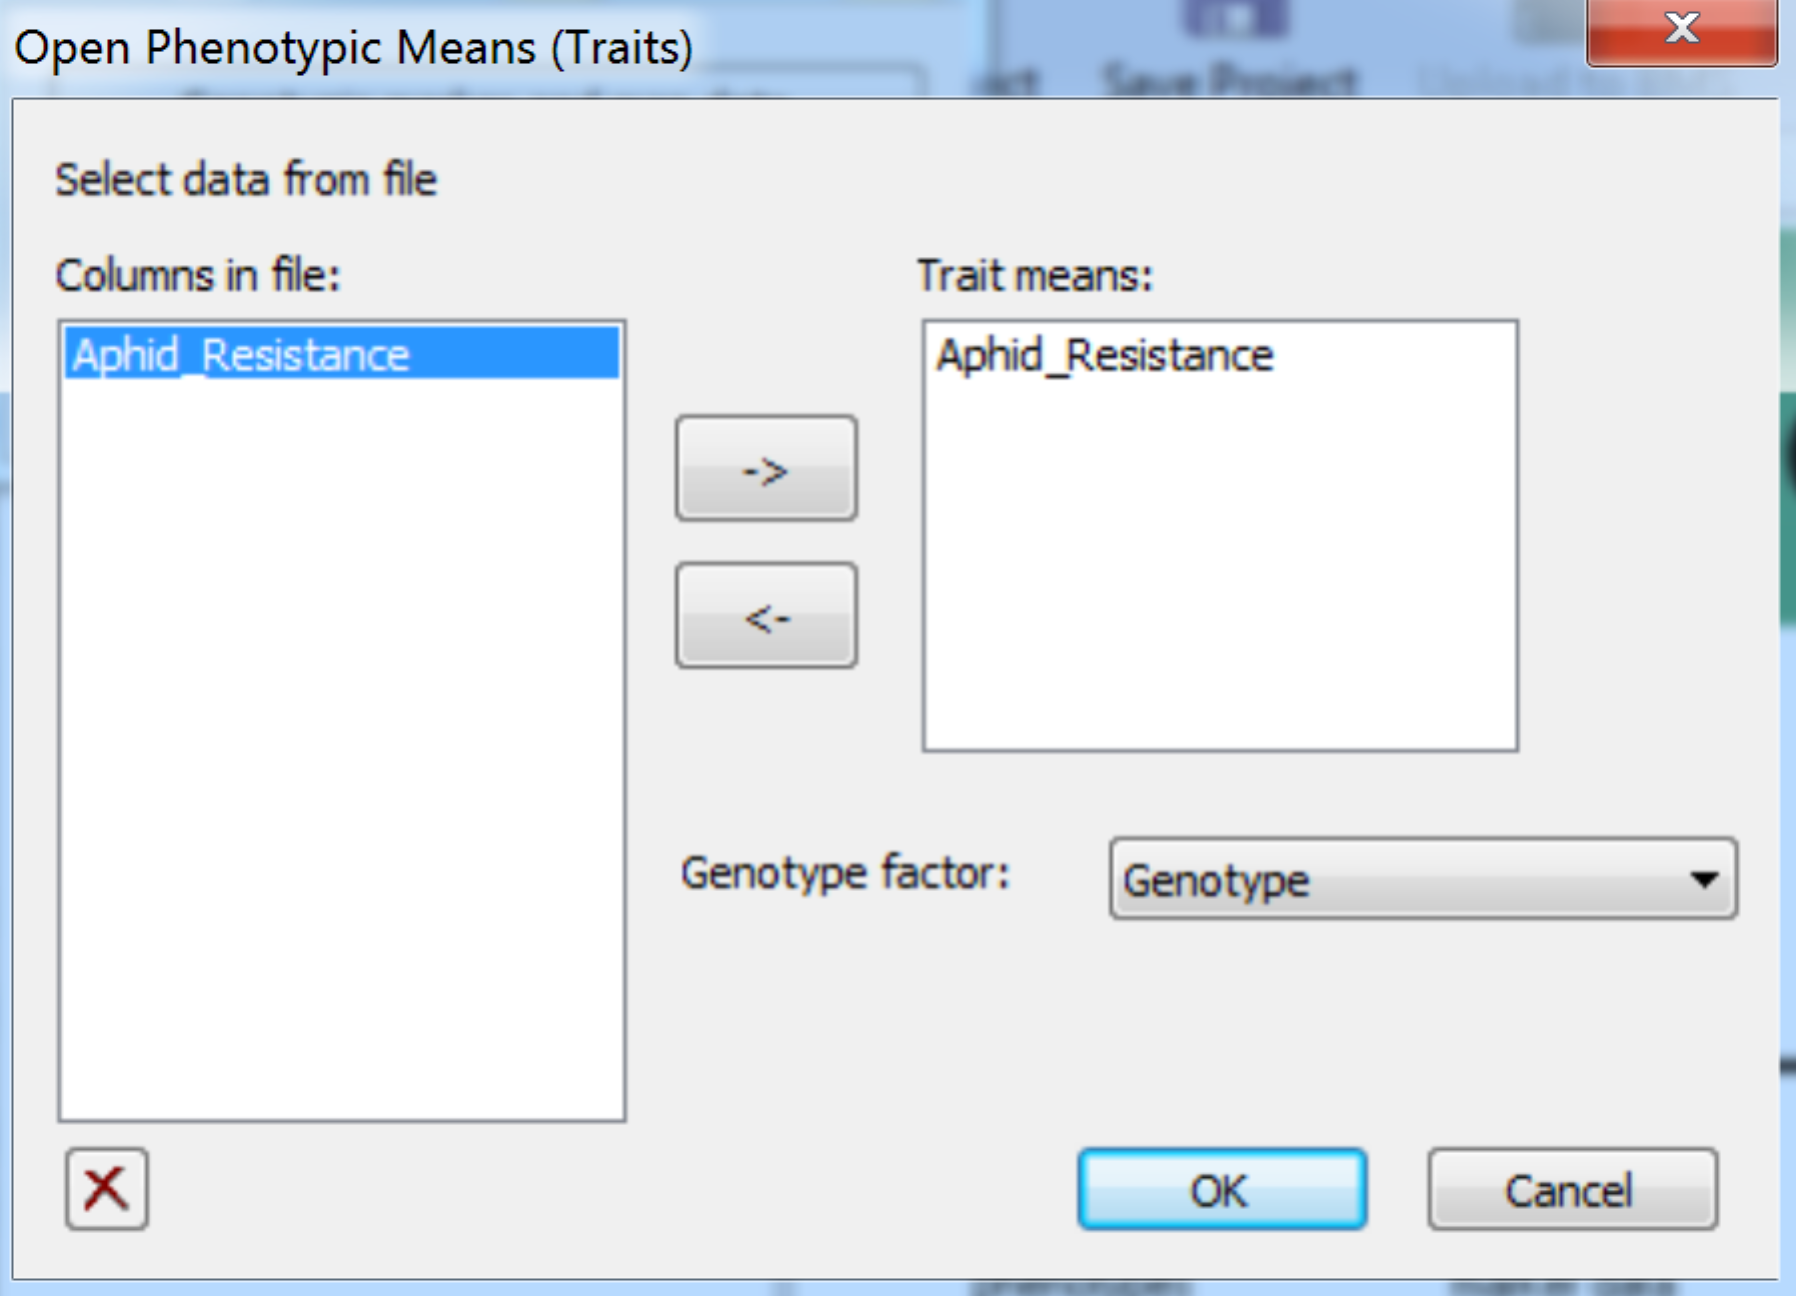
- Import the phenotypic data file by selecting Phenotypic Trait Means from the Add to Project menu. Add Aphid_Resistance to the Trait means window. Choose Genotype as the genotype factor. Click OK to import the data.
Run Analysis
After the data have been imported, the selected traits appear within Project tab on the left side of the screen. The green check mark indicates that the Aphid_Resistance trait will be used within the analysis pipeline.
- Run the QTL analysis pipeline by right clicking the the first node, Quality Control Phenotypes, and selecting Run Pipeline. This will run the whole analysis pipeline, by performing the task at each node in turn. As the task at each node is completed, the connecting arrow will change color, to indicate that the pipeline is moving onto the next task.
.png)
Analysis Options
Some of the nodes have options to control the way an analysis is performed and output that is displayed. To access the options, right-click on a node and select the Settings item from the shortcut menu. The changes to the options are retained during the current session and are saved to the project file.
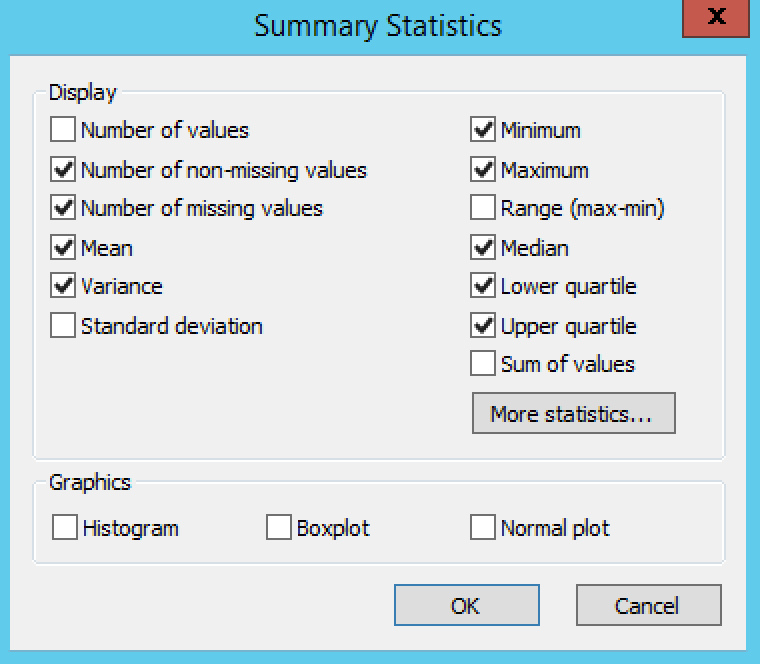
Summary Statistics
Settings under Quality Control Phenotypes define the phenotypic summary statistics that are displayed in the output.
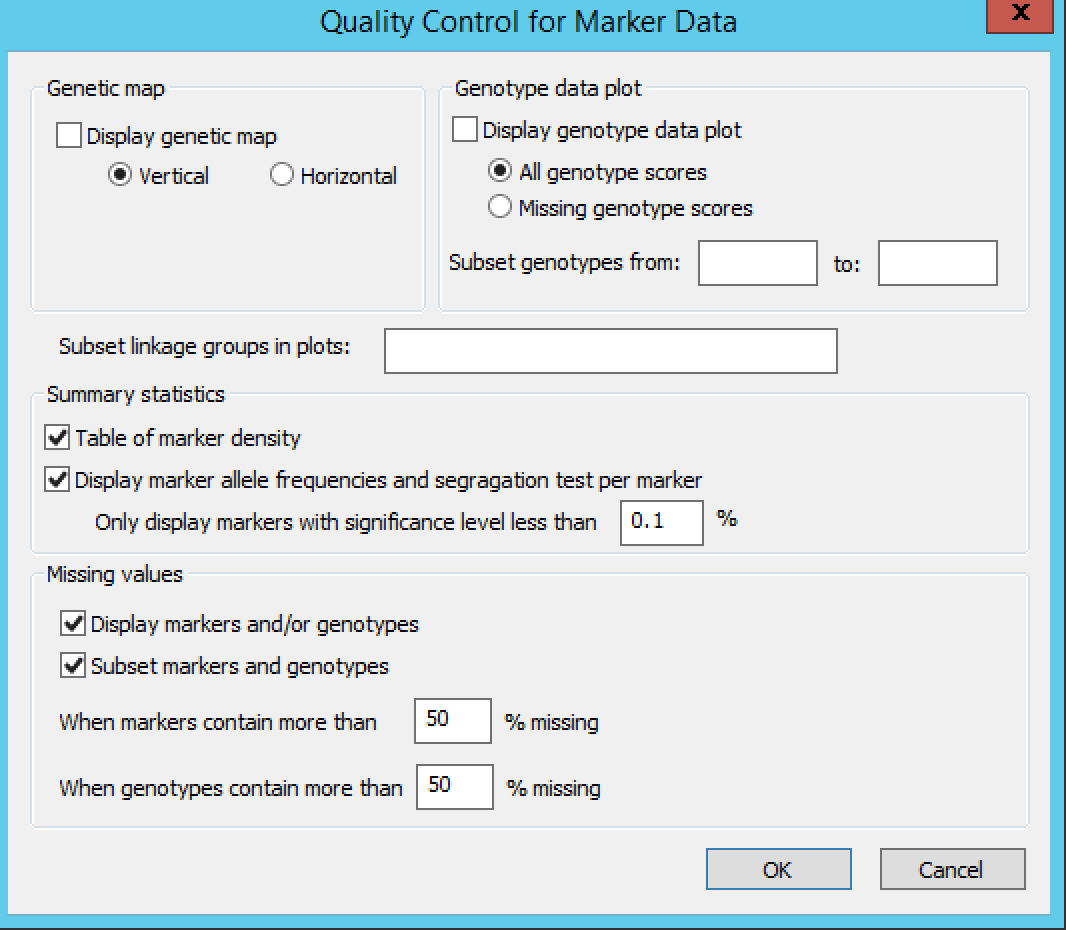
Quality Control Marker Data
Settings under Quality Control Marker Data define the display, summary statistics, and missing value thresholds for marker data.
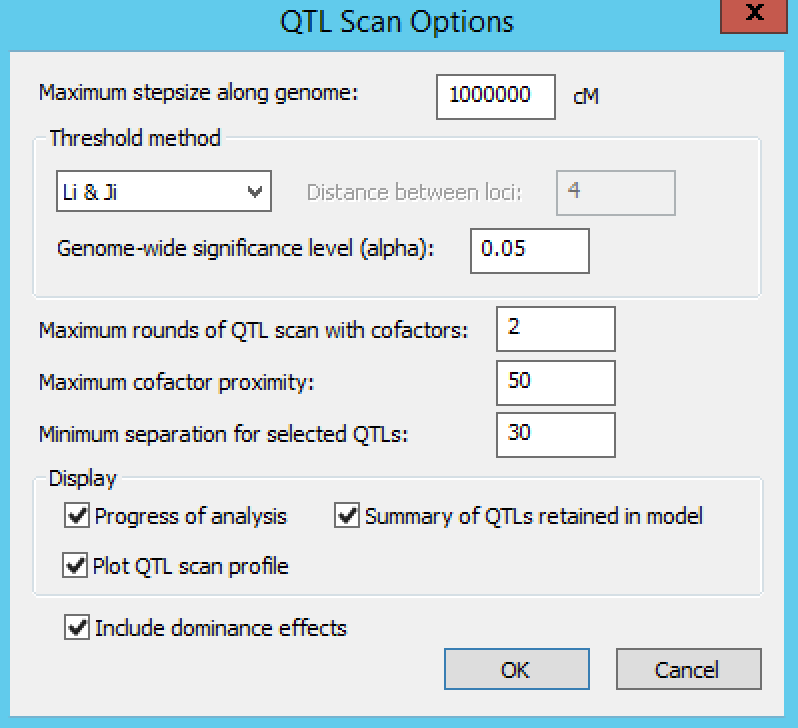
QTL Scan Options
Settings under QTL Scan Options define the QTL scanning conditions. By default, Breeding View performs a single SIM followed by two rounds of CIM scanning. The number of CIM scans can be increased until the list of detected QTLs does not change. In CIM scanning, to avoid co-linearity between cofactors and tested positions, cofactors are removed temporarily from the model when testing for QTLs close to cofactor positions. The window within which cofactors are removed is set by default to 50 cM.
Leave the default settings for this tutorial and run the entire analysis pipeline by right clicking the first node and selecting Run the Pipeline. When the analysis completes, a prompt will appear to indicate it has finished.
Restart Analysis
After a pipeline has been run, you can change settings and start again from any point along the pipeline.
Results
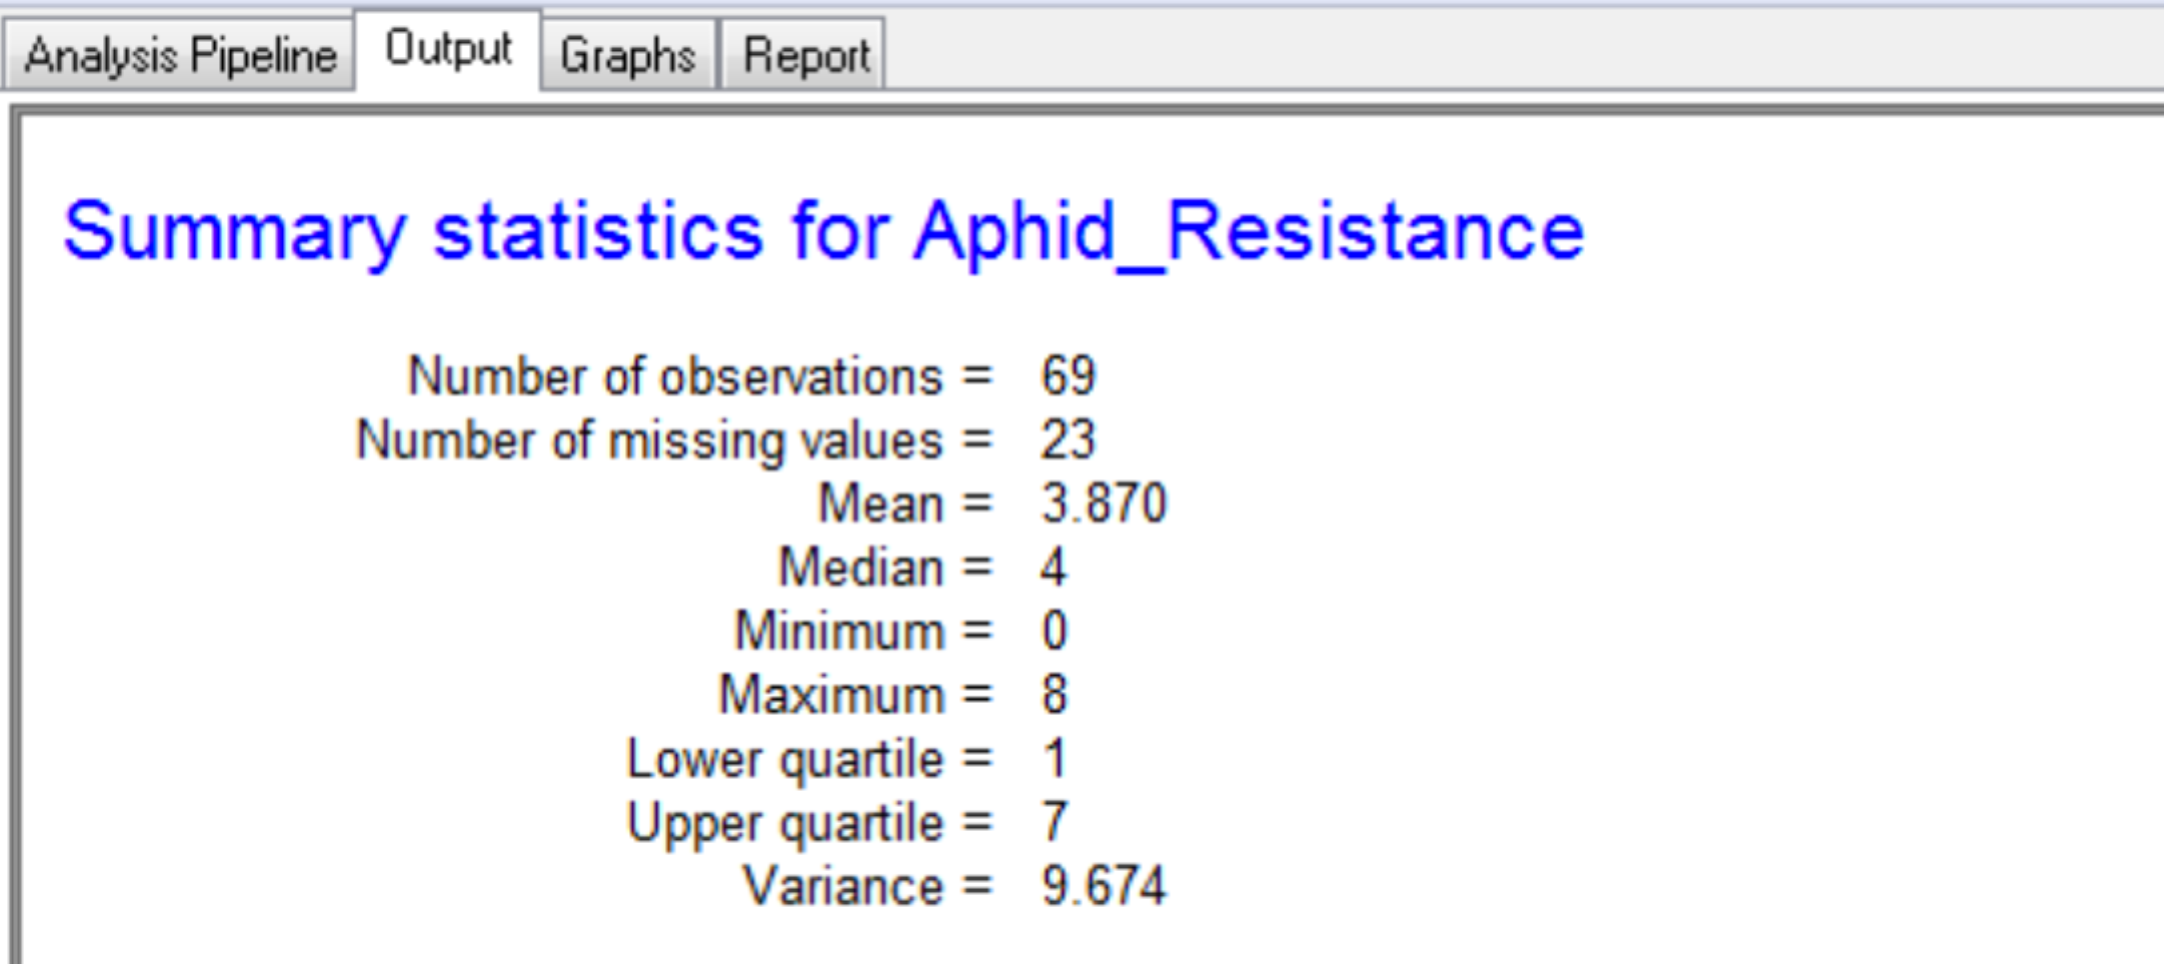
The output tab contains the summary statistics for aphid resistance scores, marker data, and detected QTL.
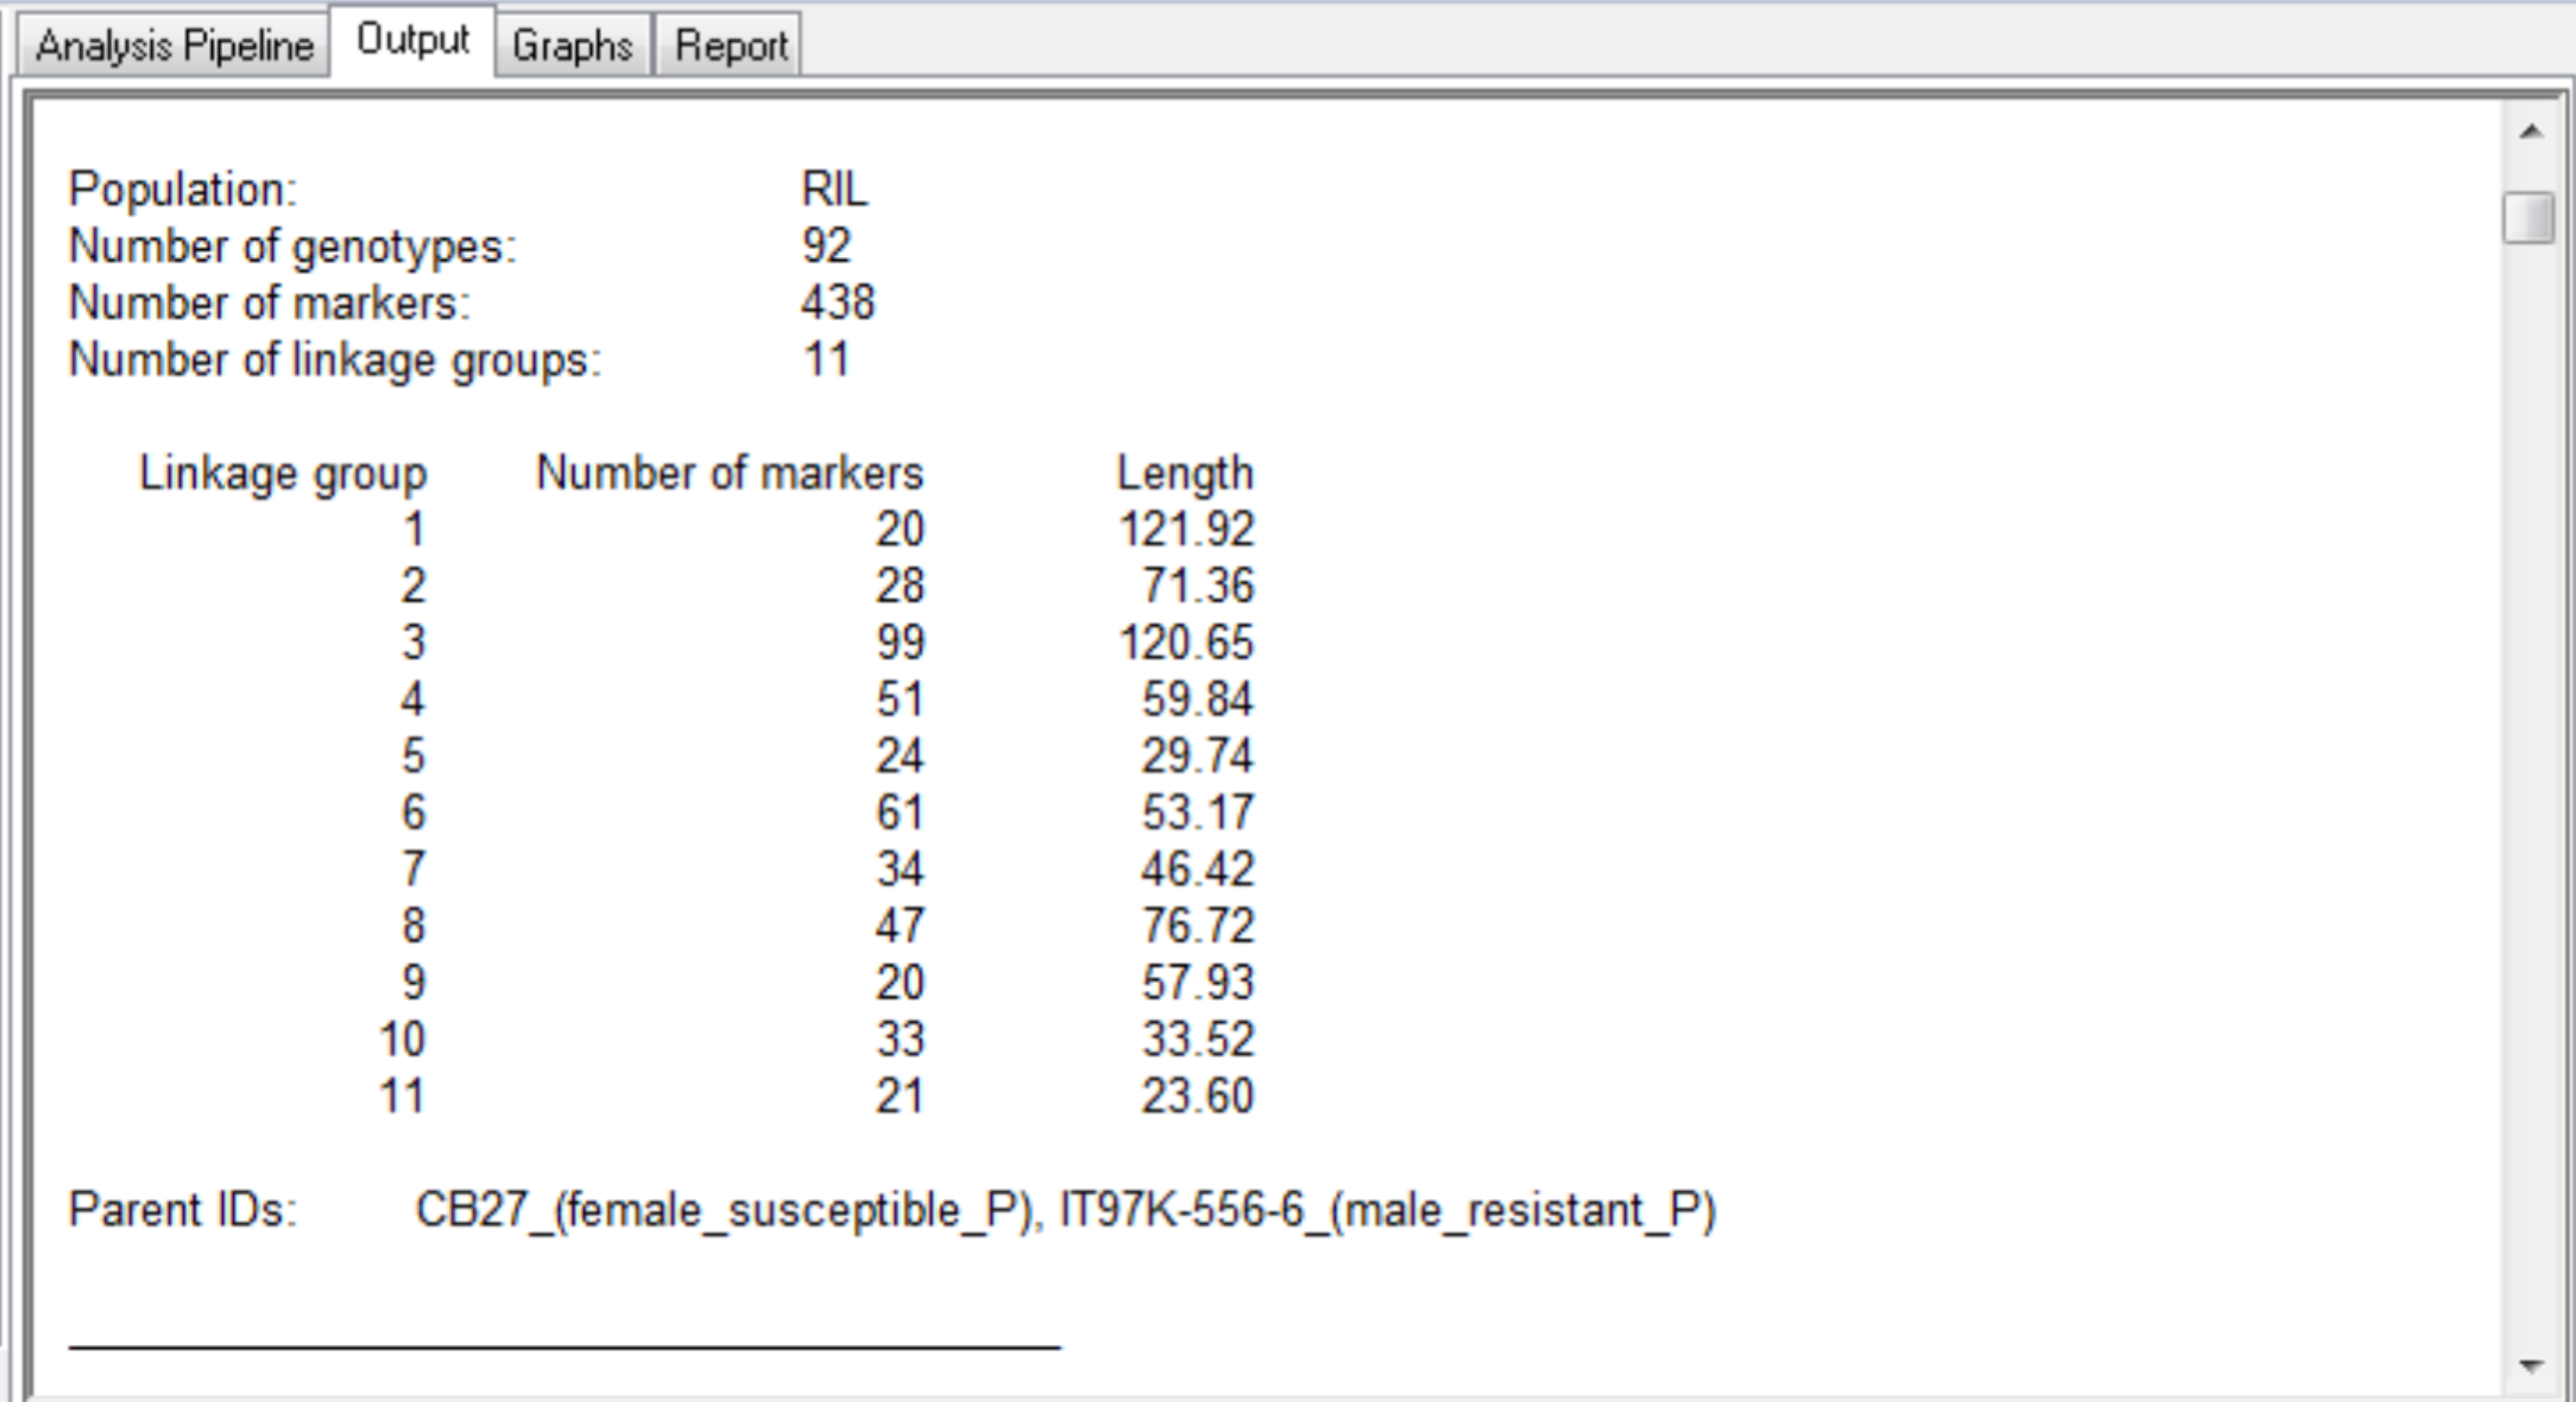
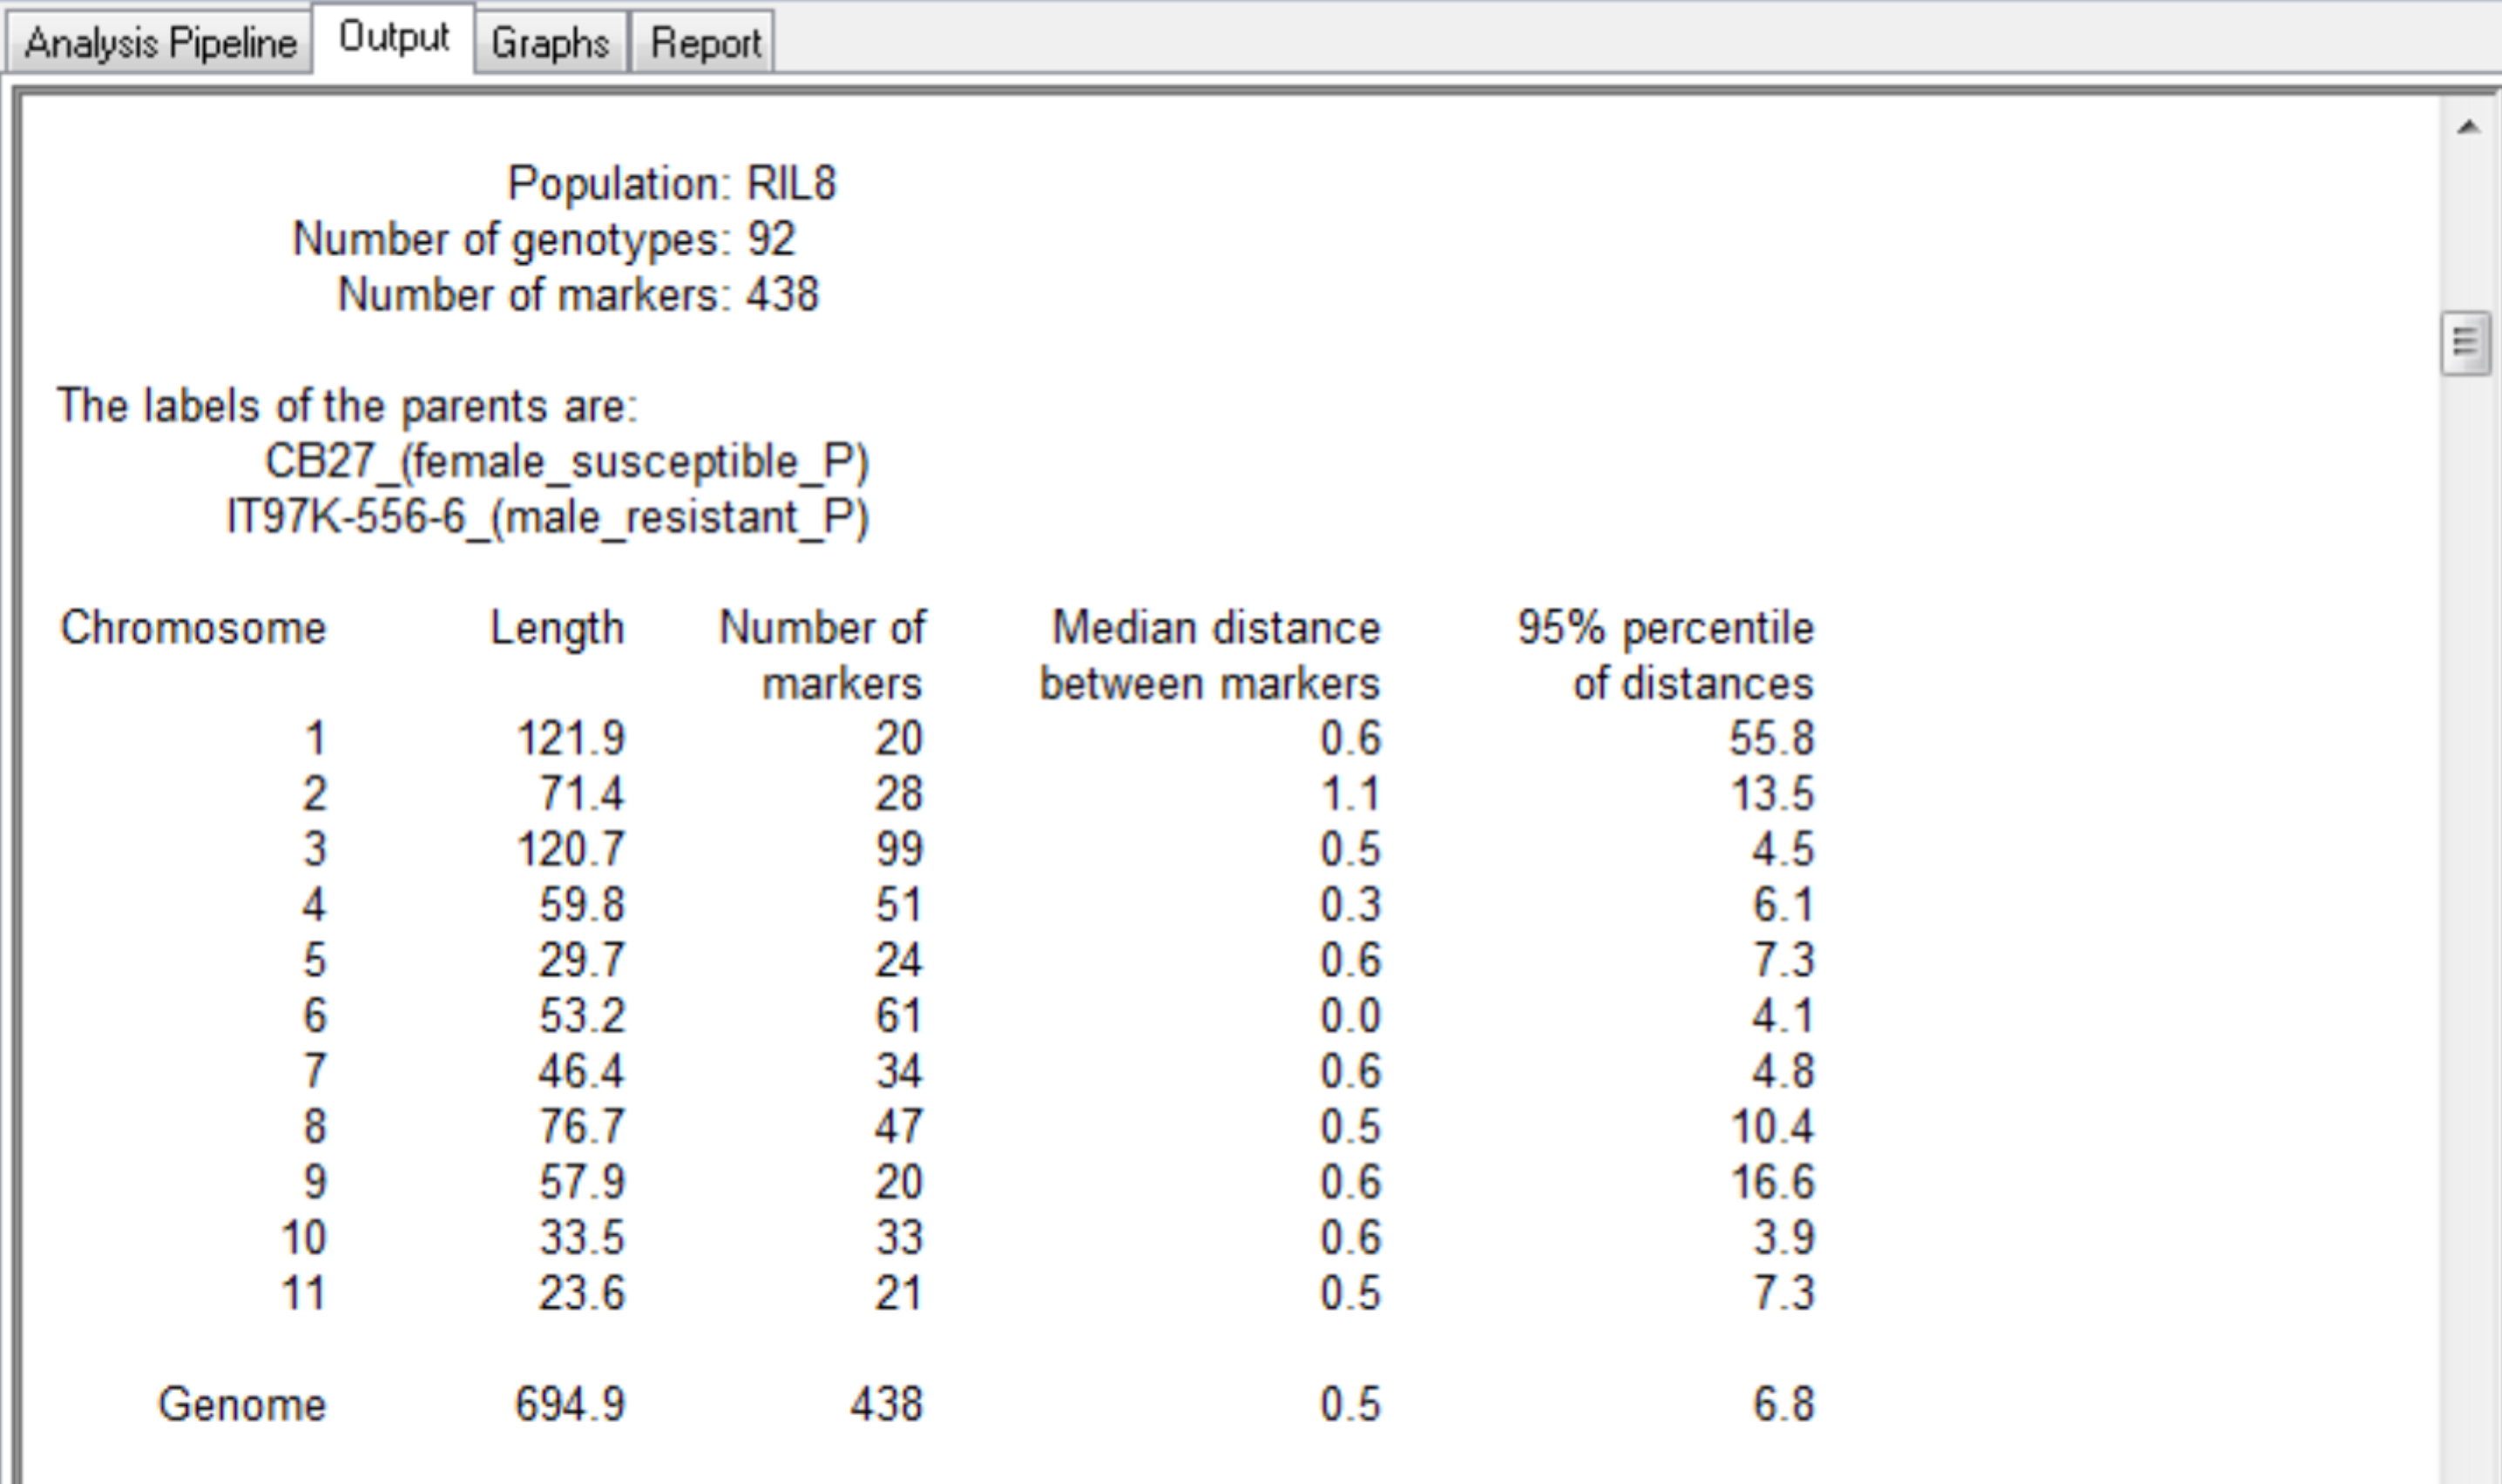
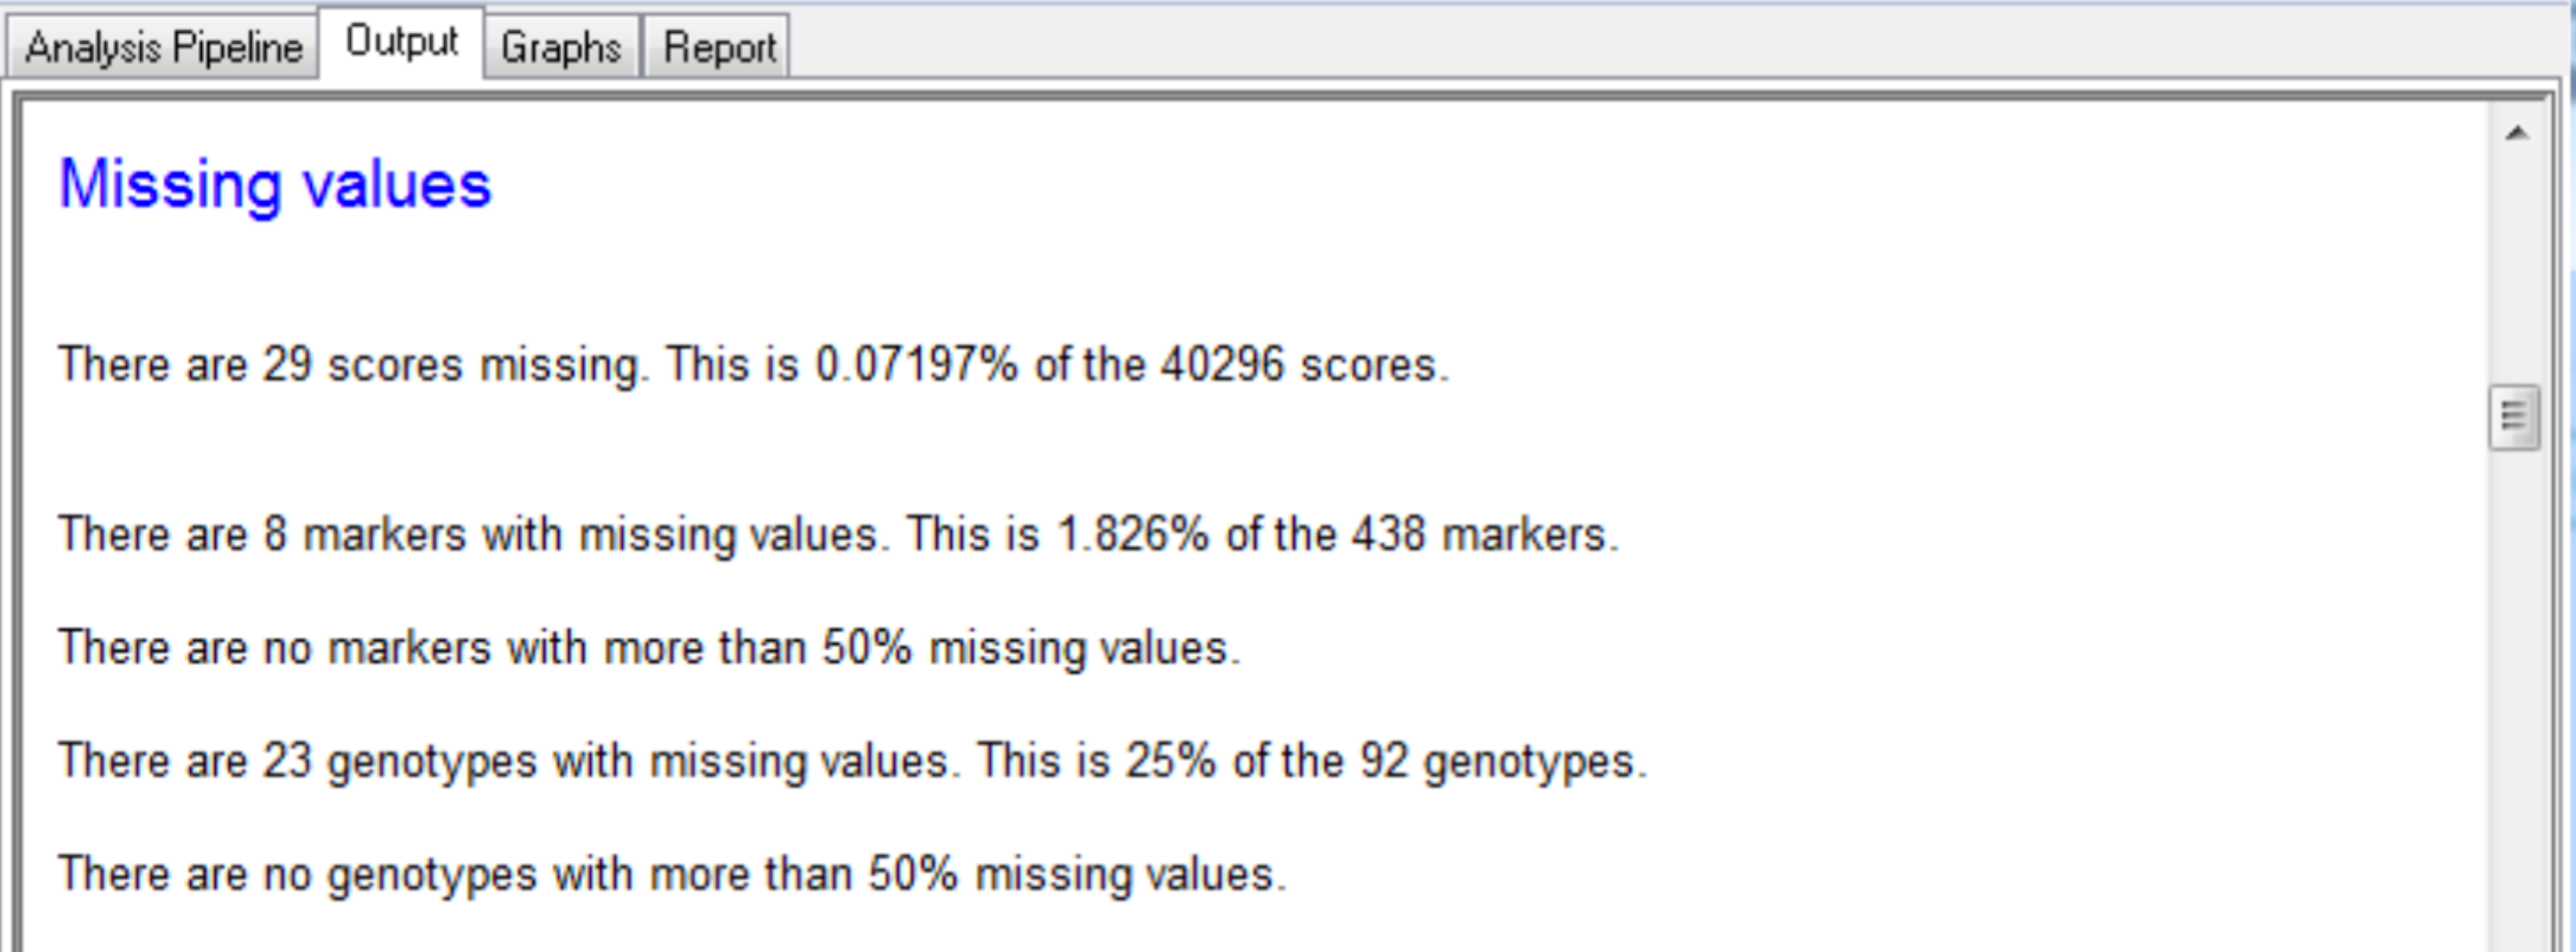
The summary for the marker data, displayed in the Output tab, provides details of the numbers of markers within each linkage group and the number of missing observations.
Output is produced for each round of SIM and CIM, with a summary of the loci greater than the detection threshold and candidate QTL.
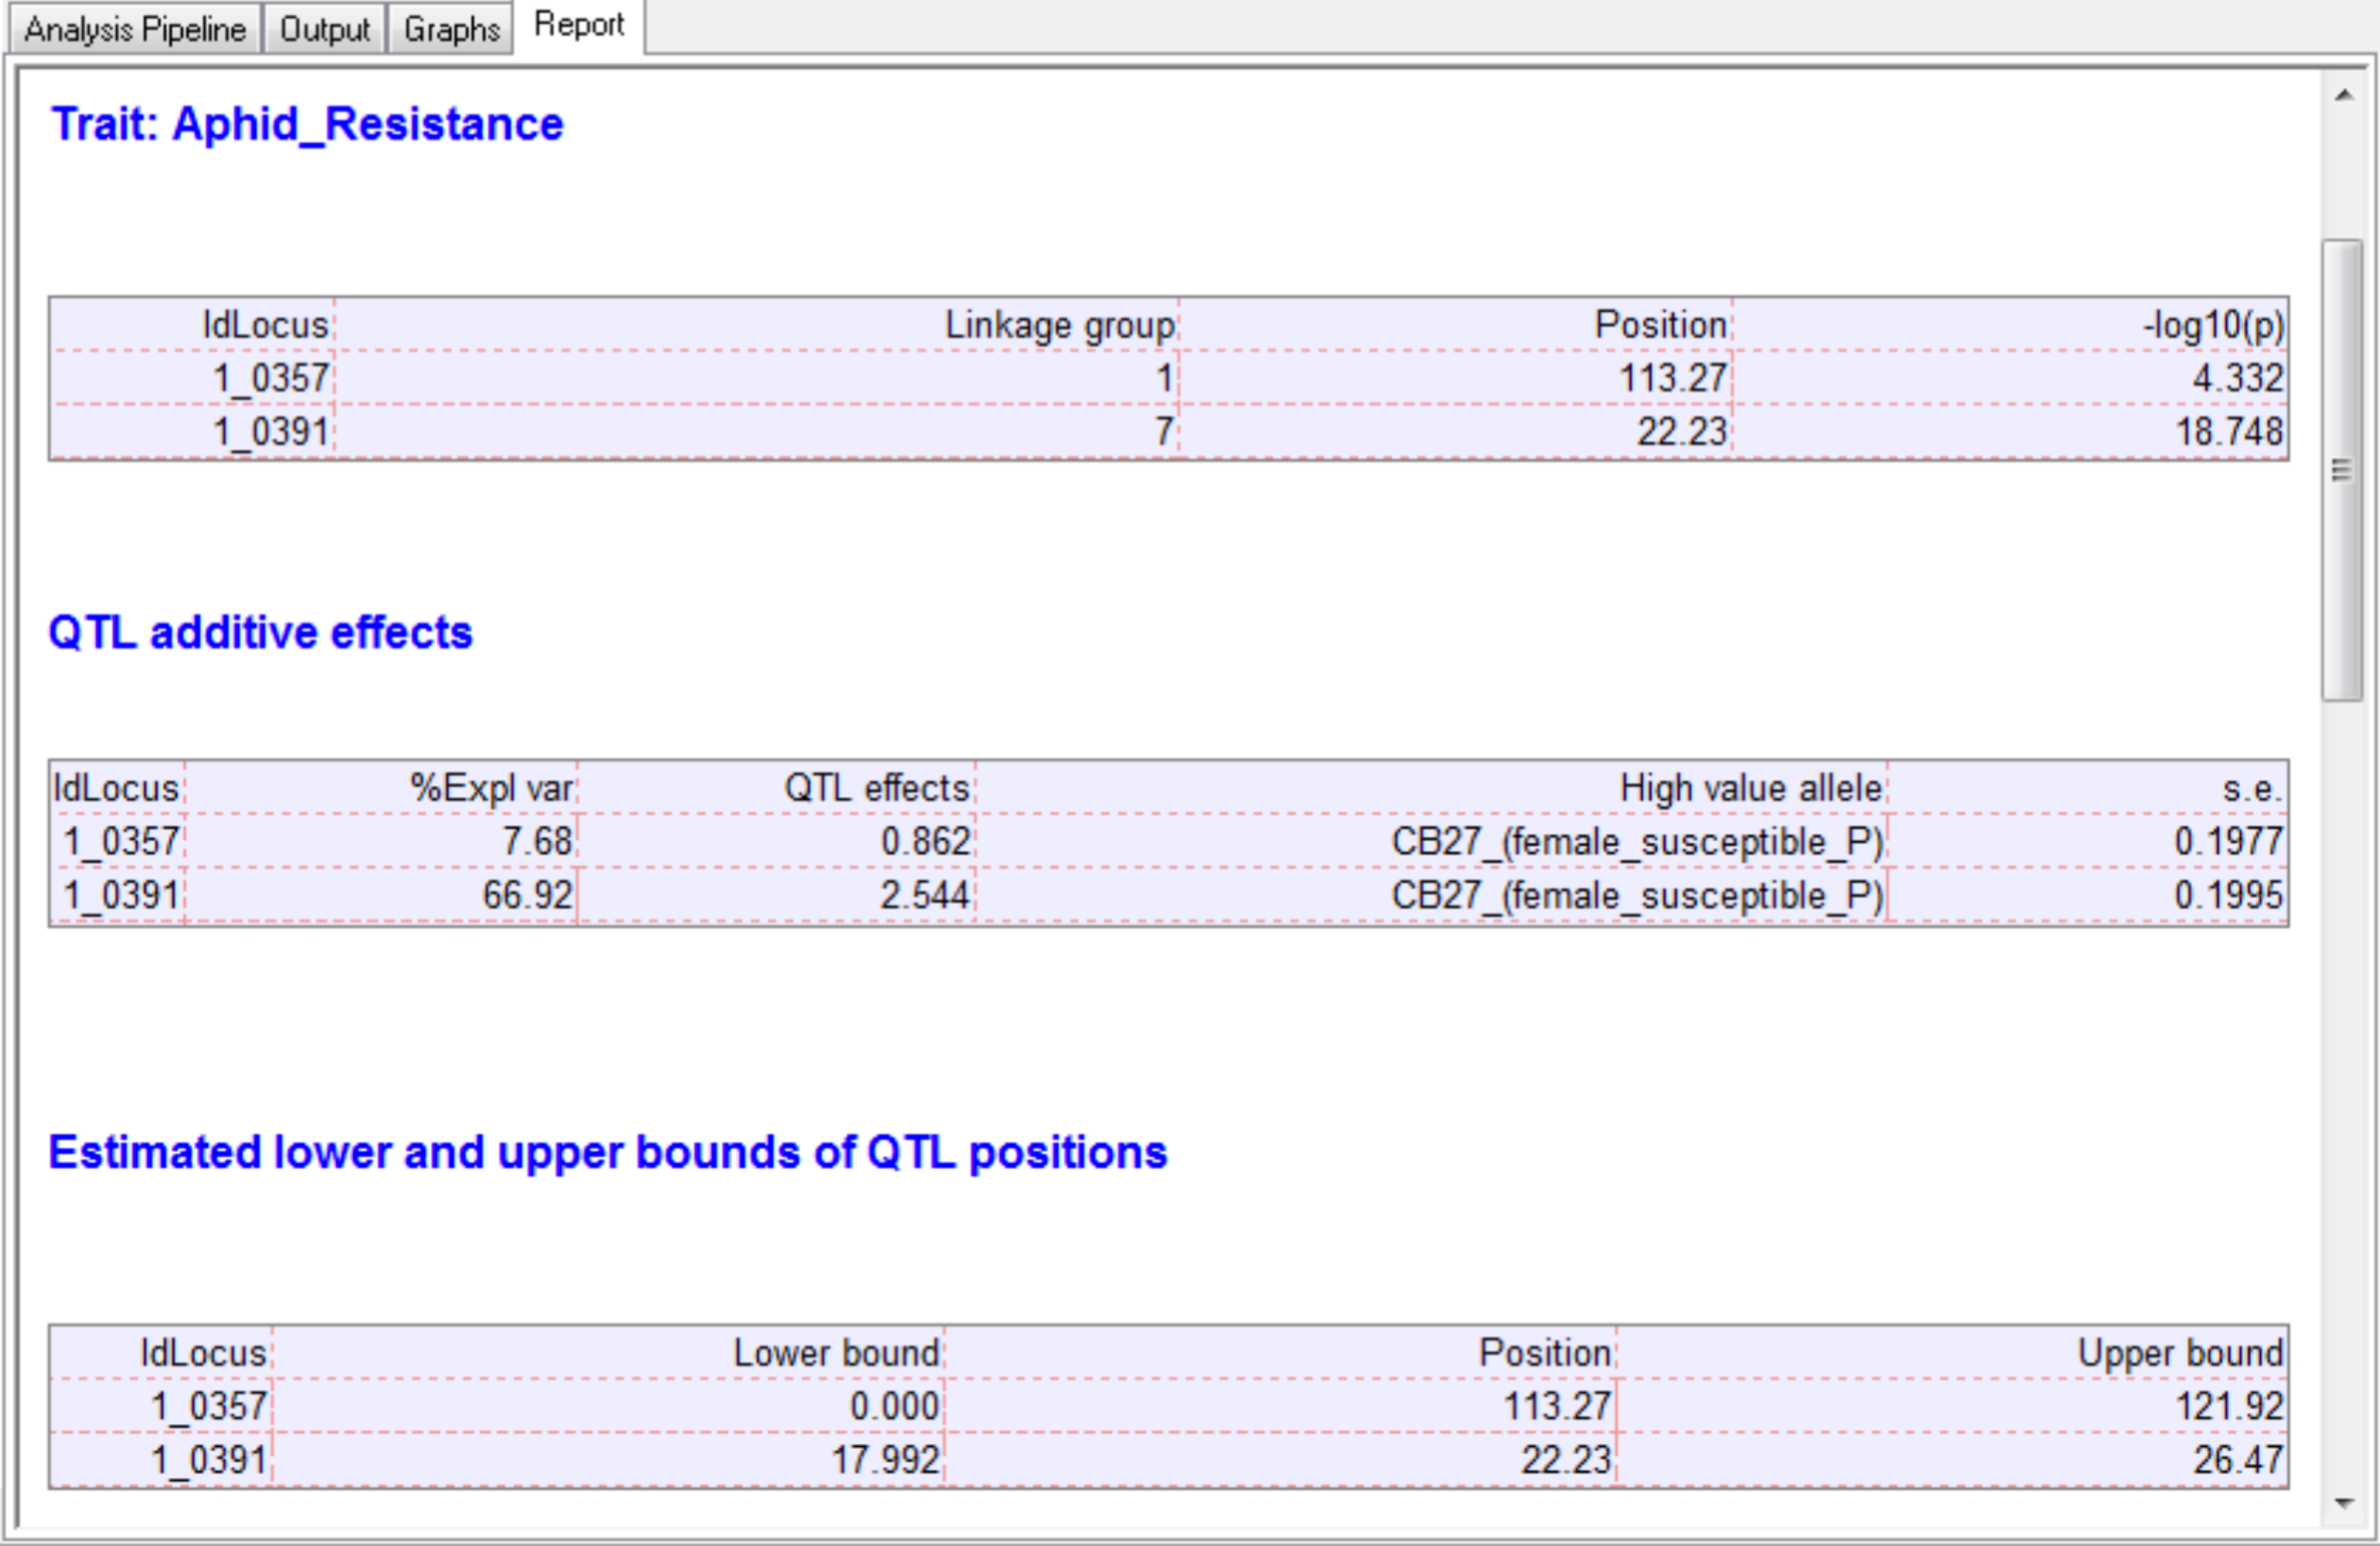
After the last round of CIM, the effects of significant QTL are estimated.
.png)
Two QTL associated with aphid resistance identified on chromosomes 1 and 7 explain 7.7 and 66.9% of the variance in aphid resistance respectively. High phenotypic values correspond to high damage symptom score of the susceptible parent, CB27.
The QTL detection produces graphs of the scan profiles for the simple interval mapping and each round of composite interval mapping. Each graph displays the profile within each linkage group, the threshold of detection, and parental contributor of the high value allele. All figures are saved as image (.png) files within the working project folder, in a subfolder using the date and time. The phenotypic identifier will begin the file name.
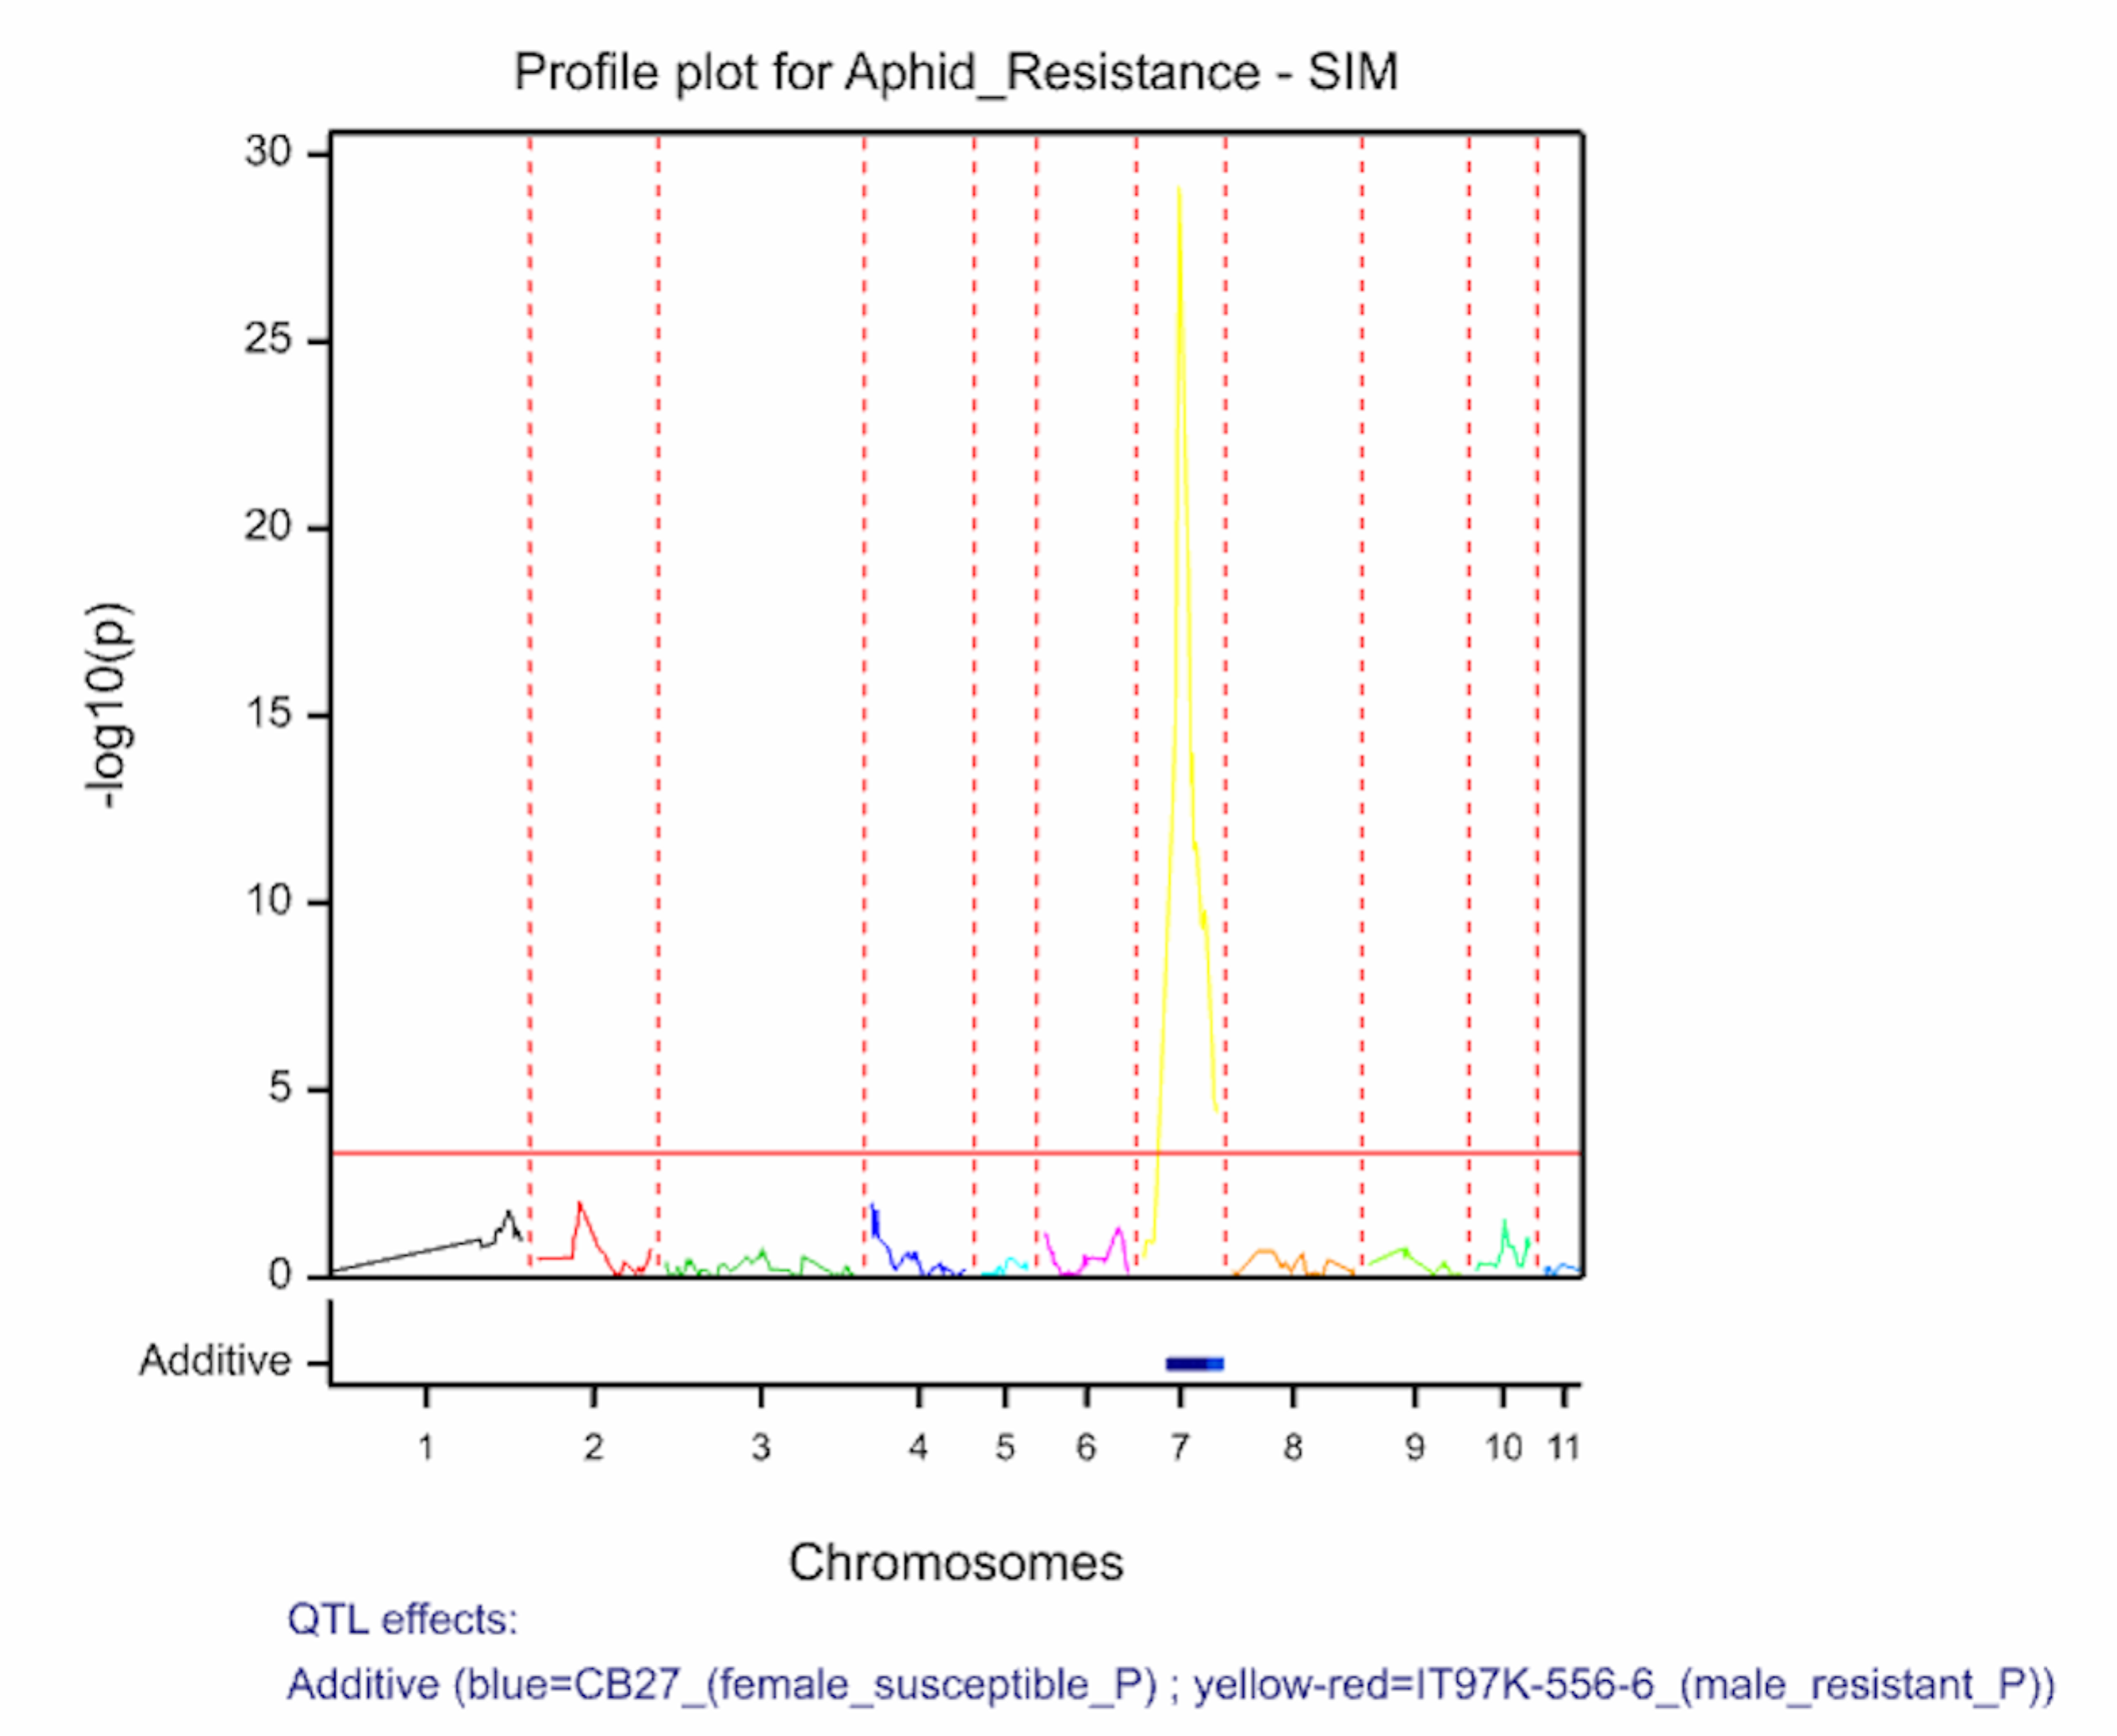
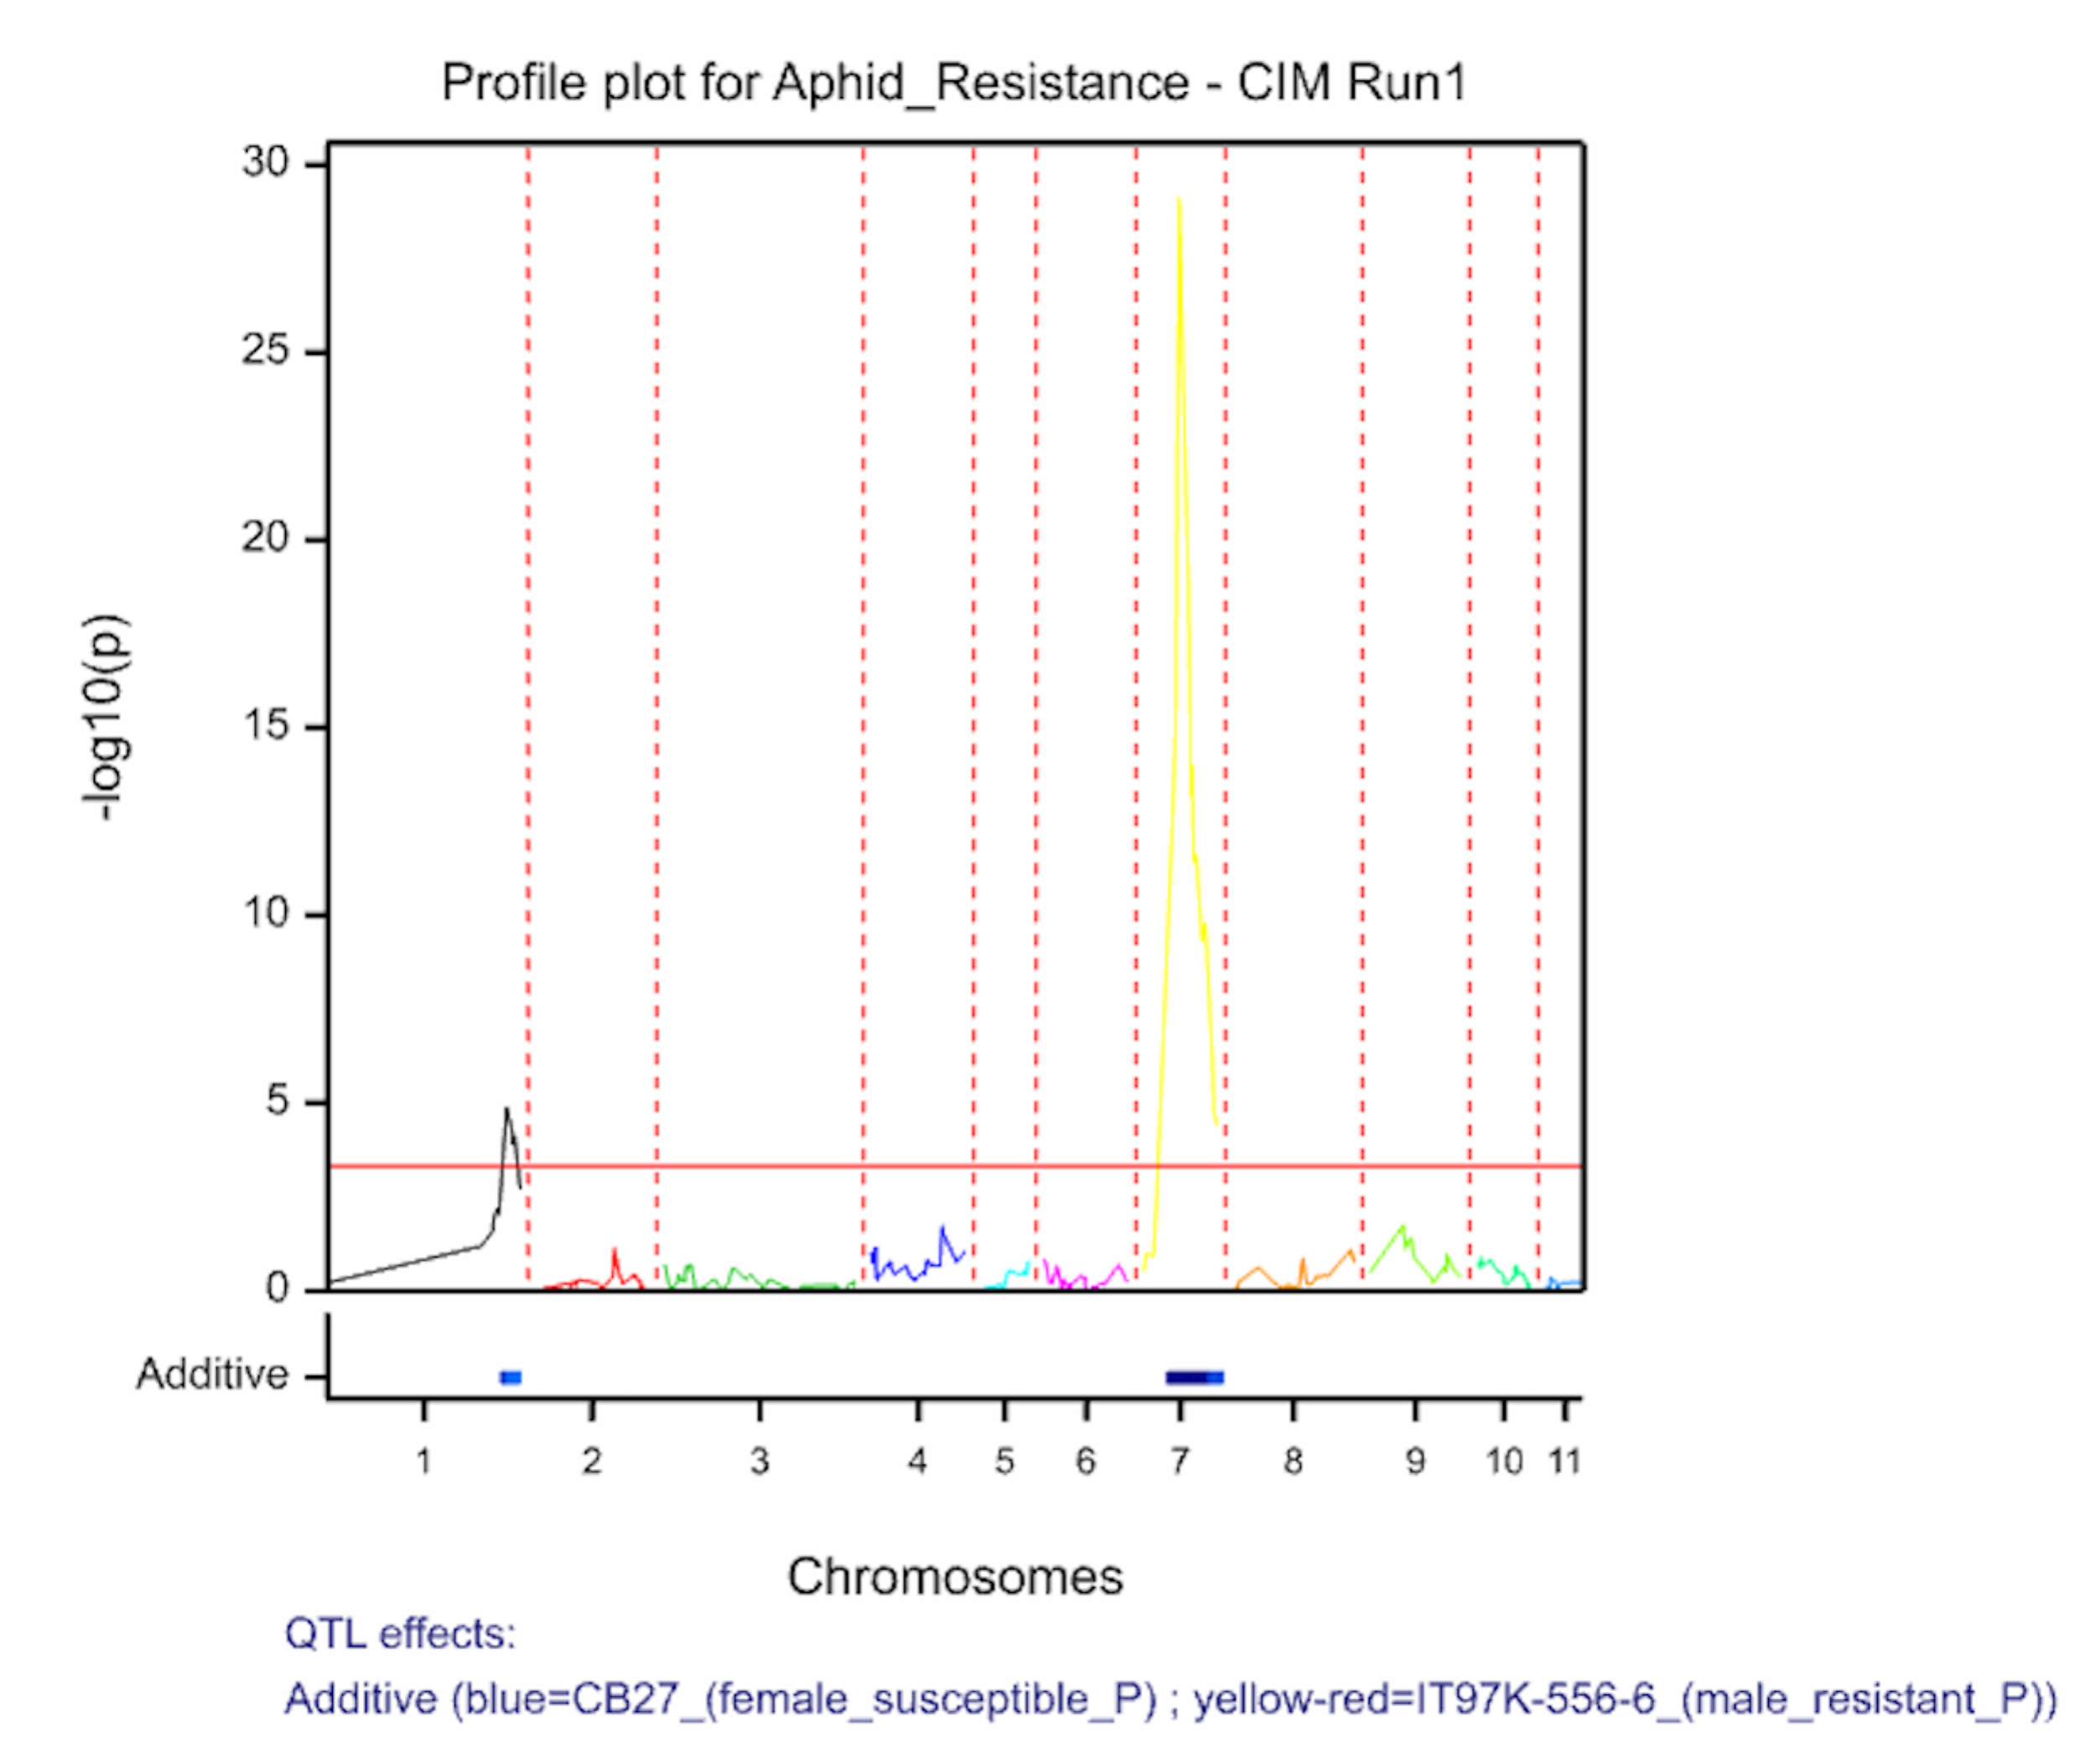
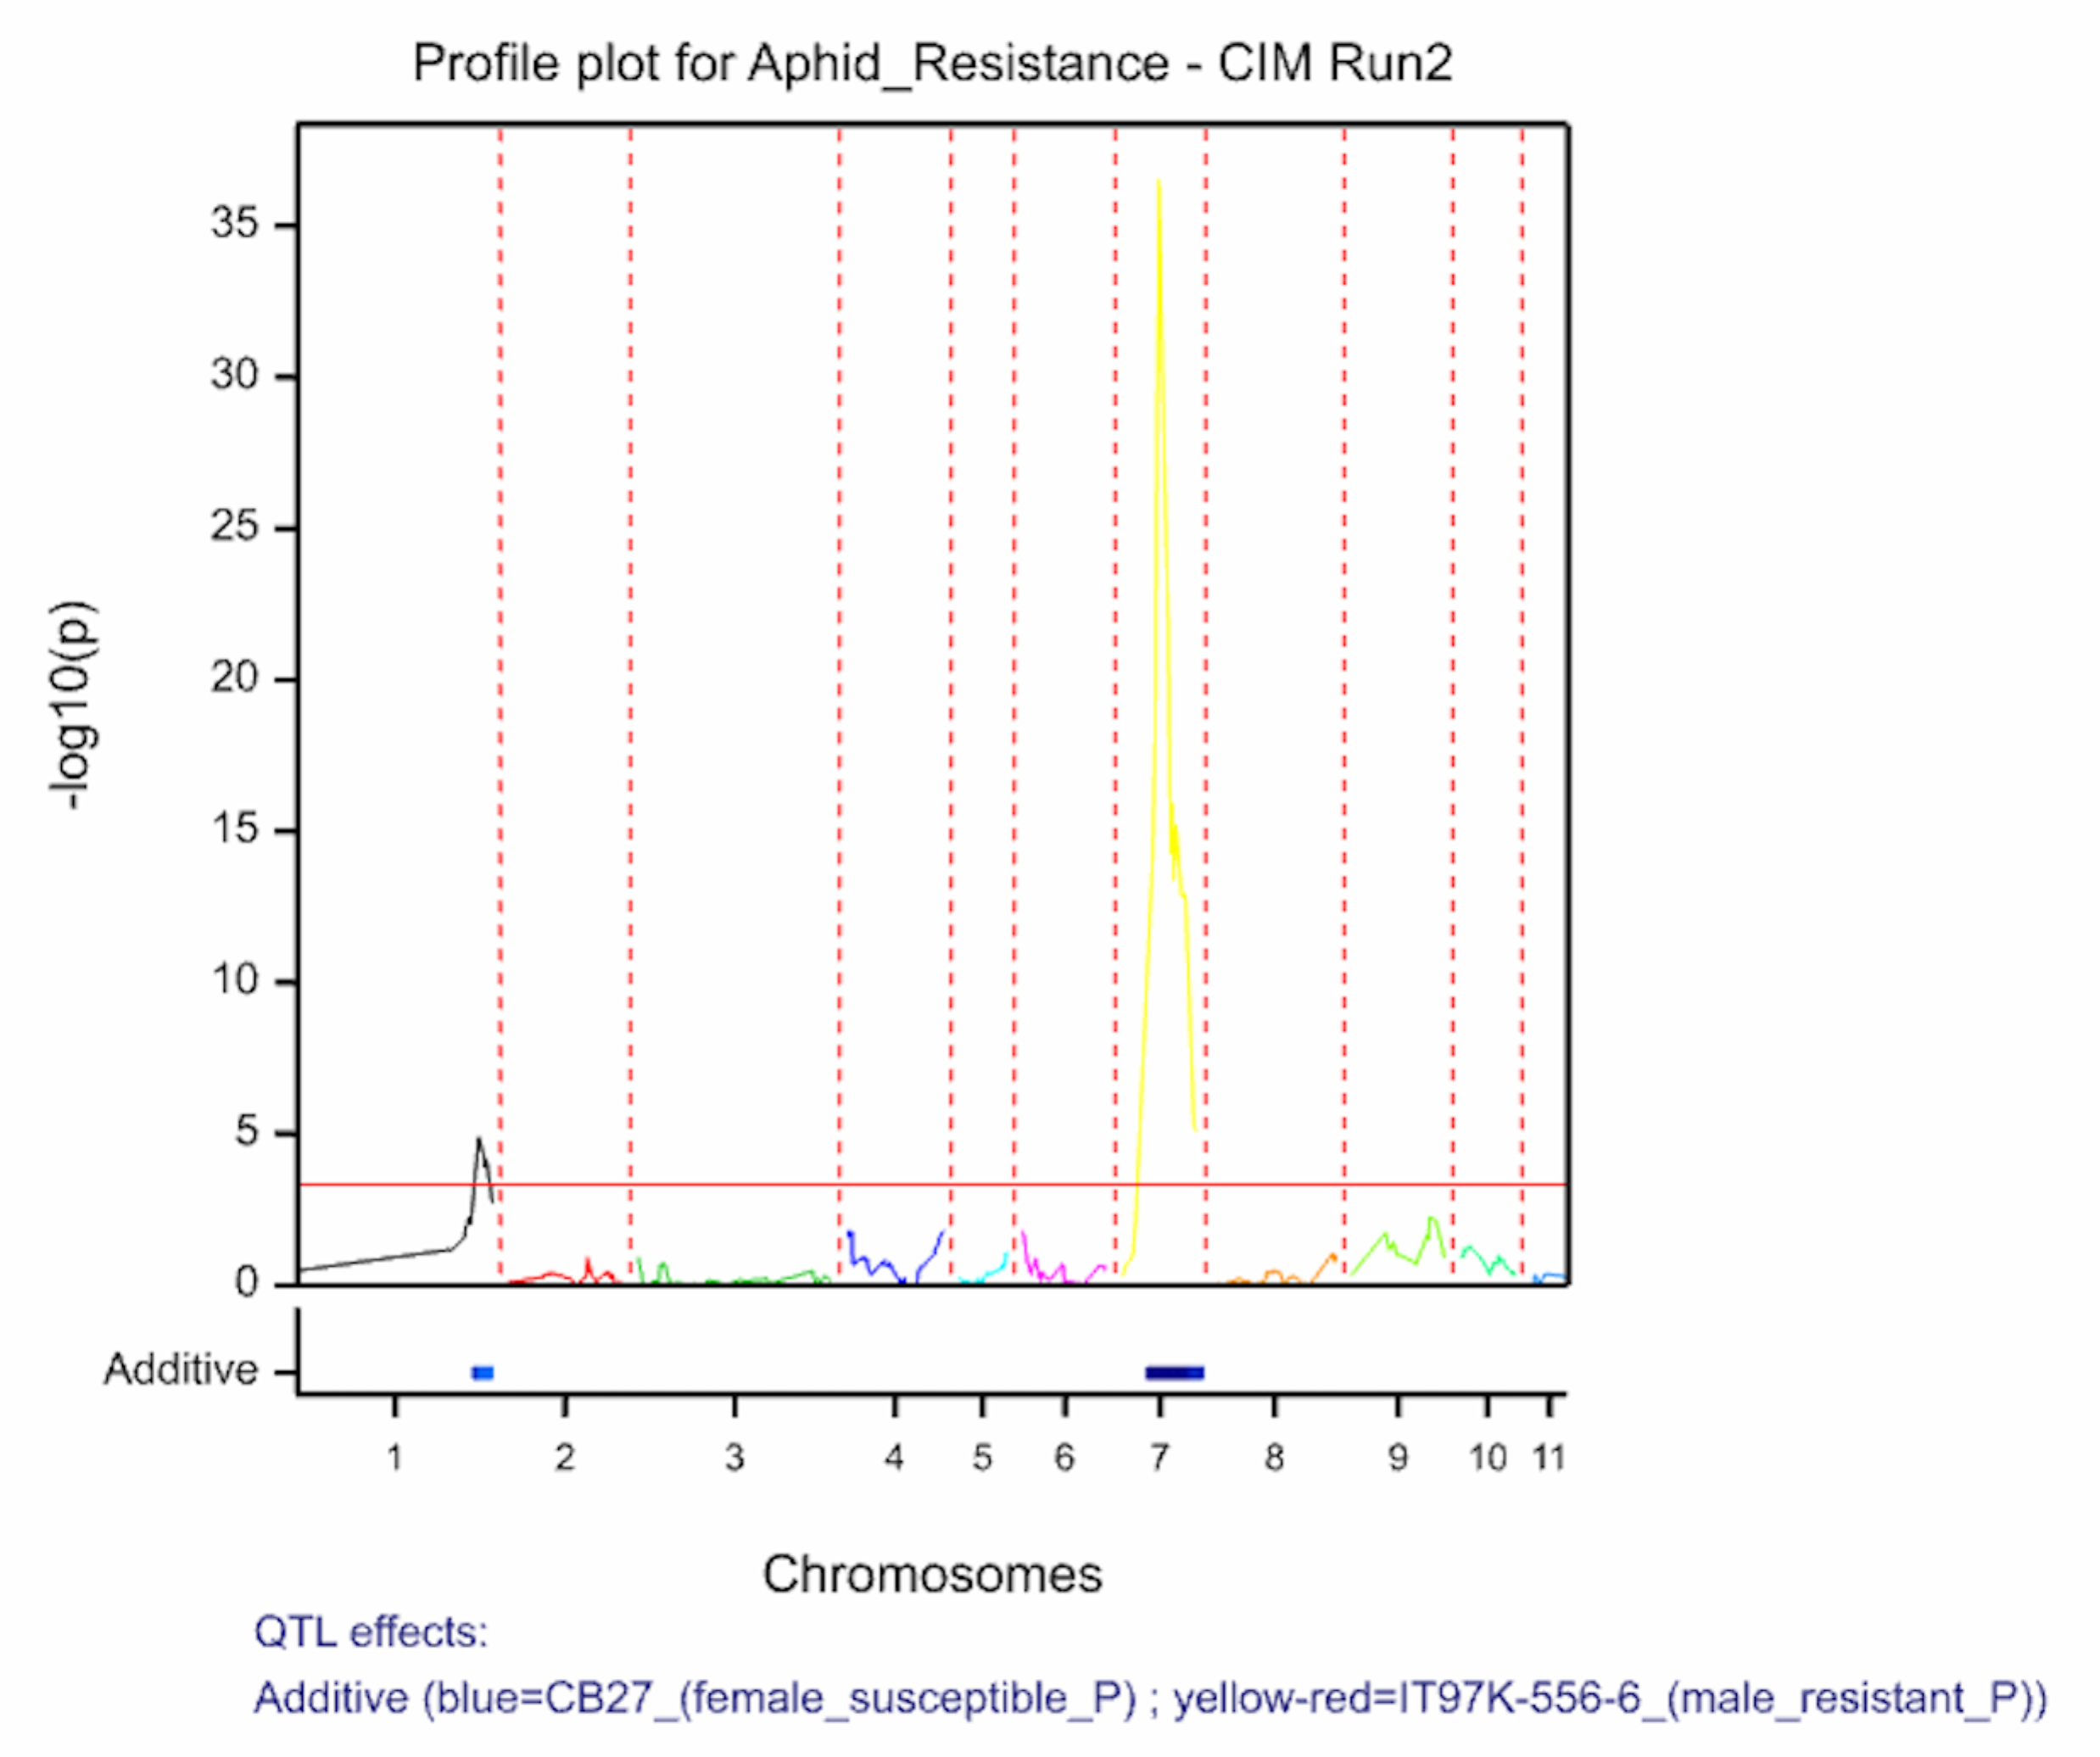
Aphid resistancs QTL profiles for SIM and two rounds of CIM
A figure where QTL are overlaid on the genetic map is automatically saved an image (.png) file to the working directory when the pipeline is run.
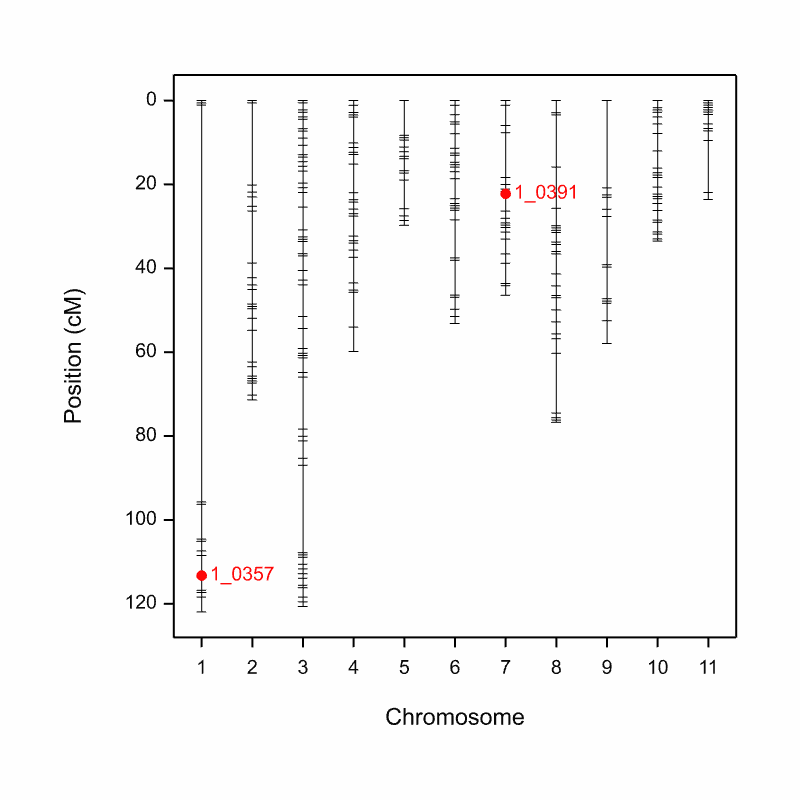
Aphid_Resistance_Report_GeneticMap001.png from the cowpea QTL demonstration data
Report
The final results are collated and displayed in the Report tab within an HTML document. The HTML report (Report.htm) is automatically saved within the working project folder, in a subfolder using the date and time.
The seed weight report and genetic map graphs are automatically named from the column heading in the phenotype file (Aphid_Resistance_Report.htm and Aphid_Resistance_Report_GeneticMap001.png).
Visualize QTL in Flapjack
When the QTL analysis pipeline is complete, Flapjack (Milne et al., 2010) automatically opens a graphical genotype display. The Flapjack project file is saved in a file within the working project folder in a subfolder using the date and time of the run. The file is automatically named Aphid_Resistance.flapjack. You may be asked to update your version of Flapjack before proceeding.
QTL are now visible on their respective chromosomes.
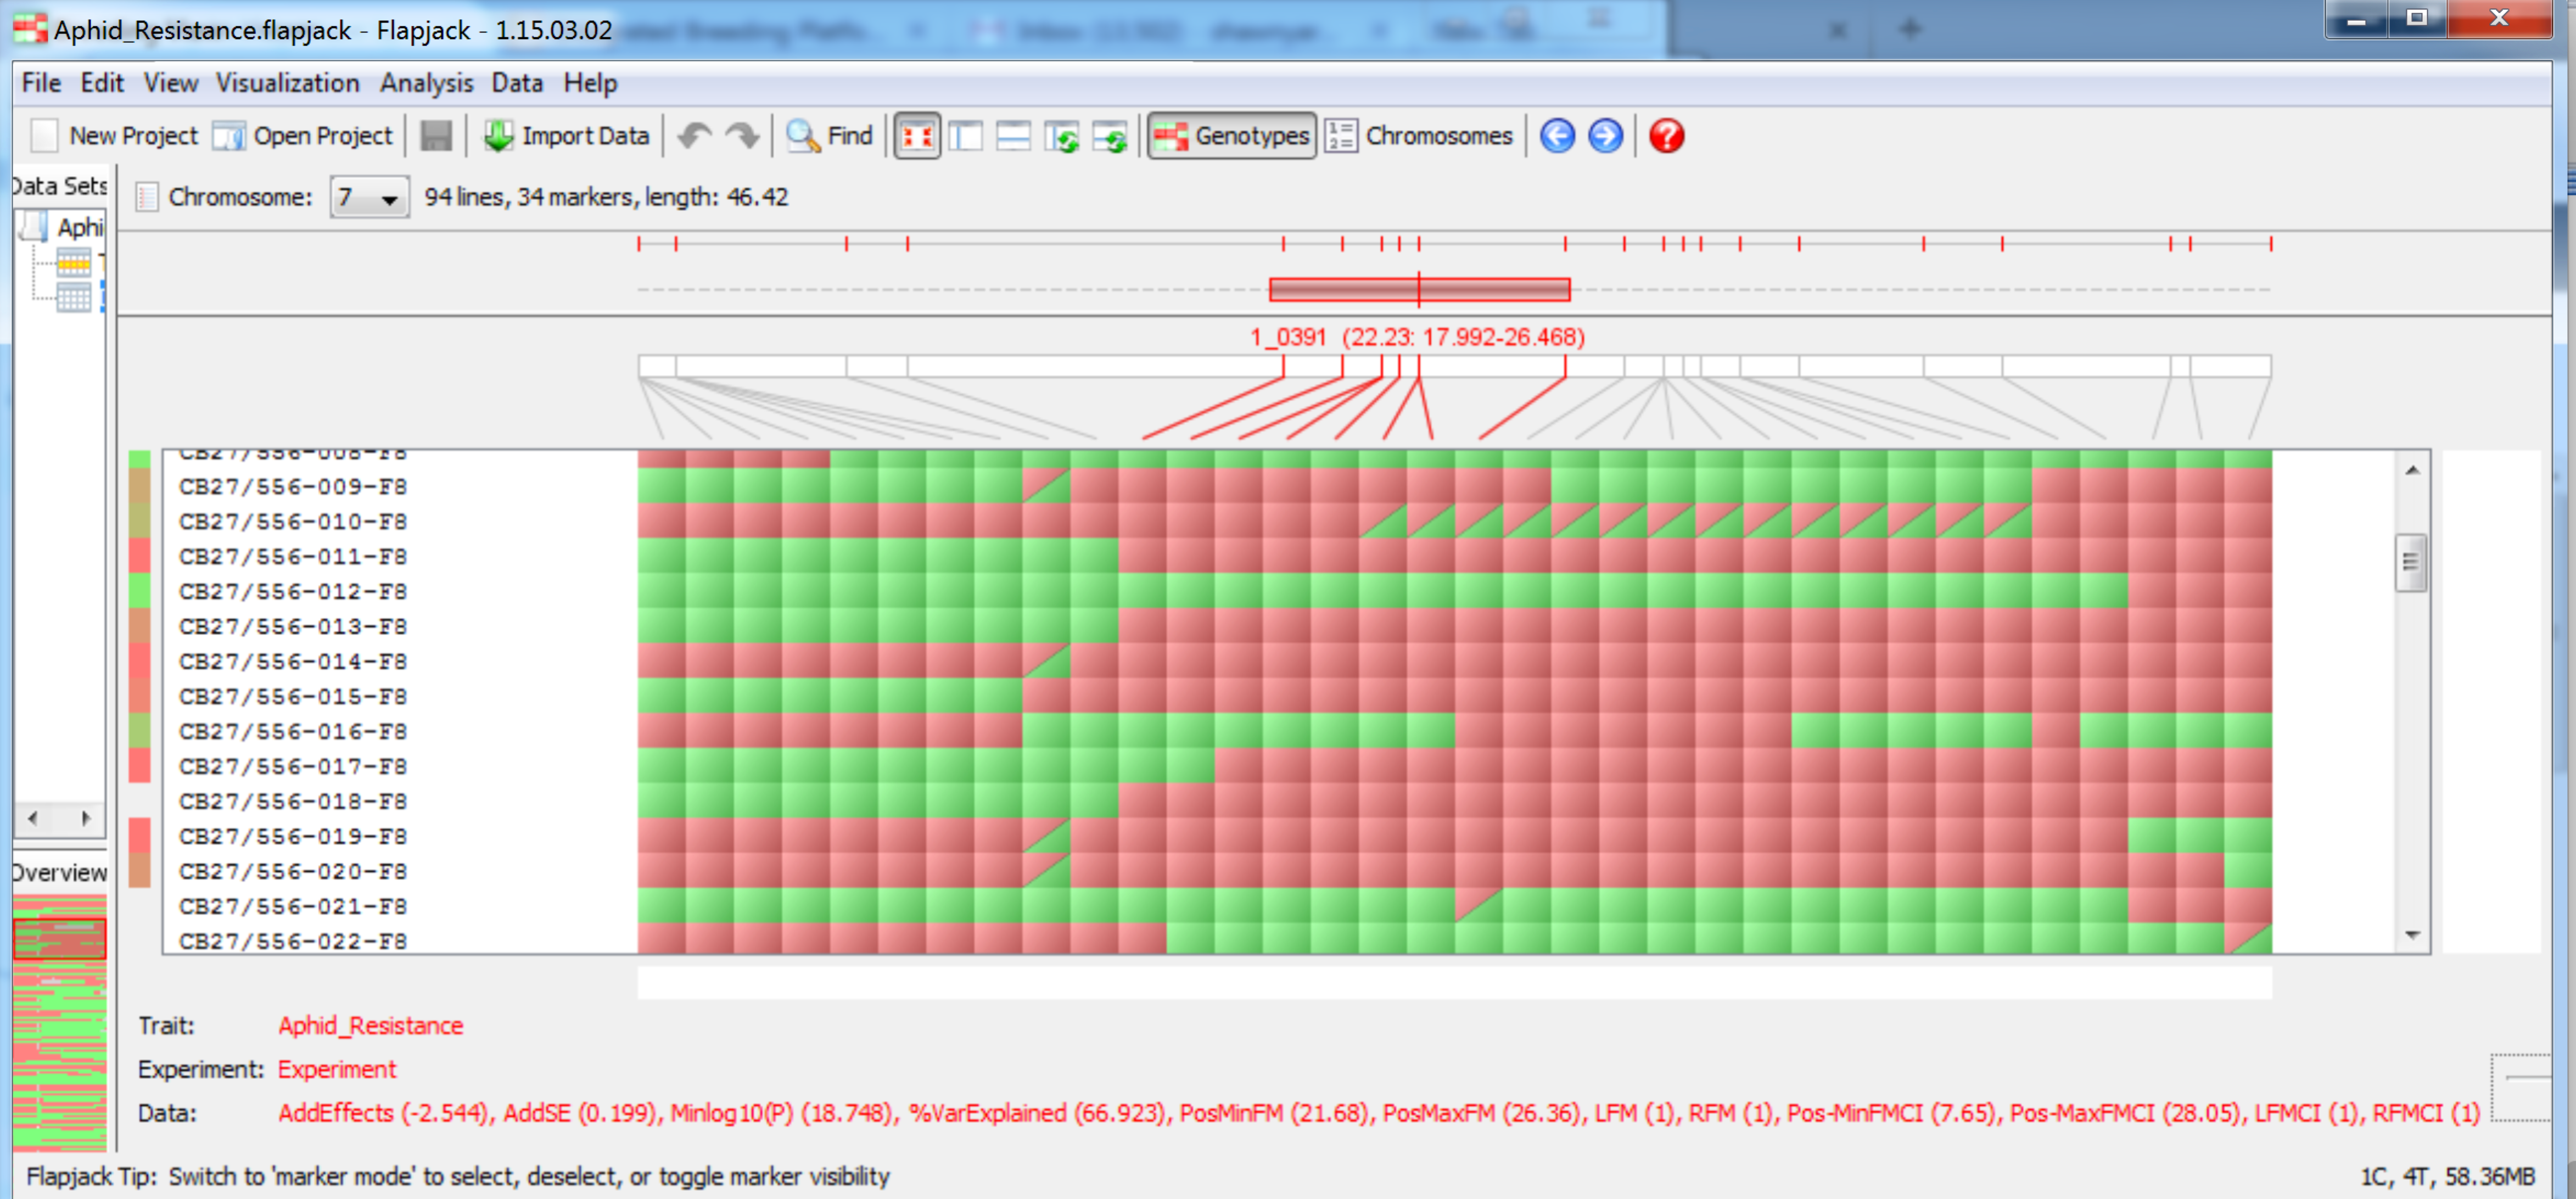
QTL associated with aphid reistance on chromosome 7 at 22.23 cM
References
Murray, D. Payne, R, & Zhang, Z. (2014) Breeding View, a Visual Tool for Running Analytical Pipelines: User Guide. VSN International Ltd. (.pdf) (Sample data .zip).
Funding & Acknowledgements
The Integrated Breeding Platform (IBP) is jointly funded by: the Bill and Melinda Gates Foundation, the European Commission, United Kingdom's Department for International Development, CGIAR, the Swiss Agency for Development and Cooperation, and the CGIAR Fund Council. Coordinated by the Generation Challenge Program the Integrated Breeding Platform represents a diverse group of partners; including CGIAR Centers, national agricultural research institutes, and universities.
The statistical algorithms in the Breeding View were developed by VSN International Ltd in collaboration with the Biometris group at University of Wageningen. Cowpea QTL demonstration data were provided by Tim Close, Philip Roberts, Bao Lam Huyuh at the University of California Riverside. These data may have been adapted for training purposes. Any misrepresentation of the raw breeding data is the solely the responsibility of the IBP.

This work is licensed under a Creative Commons Attribution-ShareAlike 4.0 International License.
